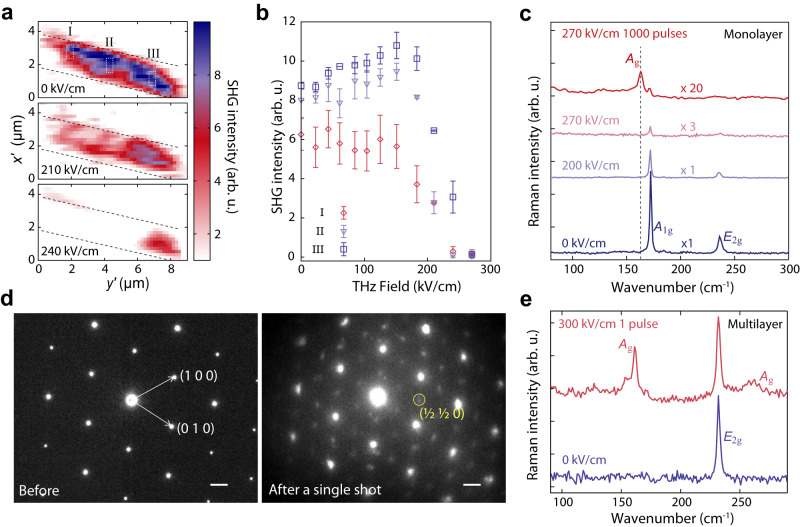
Fig. 2. THz field dependence of the phase transition in monolayer and multilayer MoTe2.
a SHG images of monolayer MoTe2 before THz irradiation (0 kV/cm), after irradiation with one THz pulse at 210 kV/cm free-space field amplitude, and after irradiation with a second THz pulse at 240 kV/cm. The dashed lines indicate the edges of gold strips in the field enhancement structure. Different areas of monolayer MoTe2 in the gap are outlined by the white dashed boxes and labeled by I, II, and III. The primes in and of the axes are added to differentiate the x–y coordinates in Fig. 1 due to the rotated field of view in SHG microscopy. b SHG from different areas (I–III) in a measured after irradiation of the sample by single THz pulses with successively increasing field strength. The vertical error bars measure the deviation of the averaged SHG intensity in the regions of interest from that of nearby pixels in the image. c Raman spectra of monolayer MoTe2 samples prior to THz irradiation (blue curve), after THz irradiation with a single pulse at 200 kV/cm (violet curve), another single pulse at 270 kV/cm (pink curve), and 1000 pulses at 270 kV/cm (red curve). The monolayer MoTe2 sample shows the Ag mode at 163.5 cm−1 after irradiation with 1000 pulses at 270 kV/cm. d Electron diffraction pattern of a multilayer ( ~ 10 layers) MoTe2 before and after a single THz pulse irradiation at 300 kV/cm, showing the emergence of superstructure peaks (yellow circle) that are characteristic of the phase. The scale bars represent 0.1 Å−1. e Raman spectra of the multilayer MoTe2 before and after a single THz pulse irradiation at 300 kV/cm, showing the emergence of new Raman peaks that are characteristic of the induced 1 phase.

