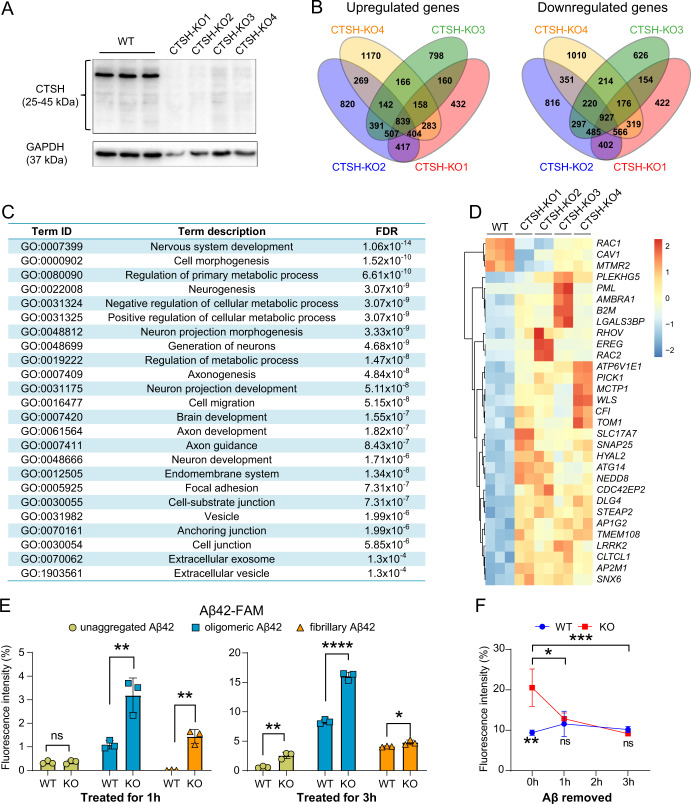
Fig. 4. Knockout of the CTSH gene in human microglial cells alters gene expression pattern and increases phagocytosis of Aβ42.
A Successful knockout of the CTSH gene in wild type human microglia (HM) cells by using the CRISPR/Cas9 system. Four CTSH knockout (KO) cell strains (CTSH-KO1, CTSH-KO2, CTSH-KO3, CTSH-KO4) were selected for the assays. The GAPDH was used as the loading control. B Venn diagram of differentially expressed genes among the four CTSH knockout cell strains. C Pathway enrichment analyses of differentially expressed genes between wild type and CTSH KO in HM cell strains. FDR, false discovery rate. D Heatmap of genes enriched in endocytosis pathway. E Phagocytosis of Aβ42 in WT and CTSH KO HM cells. Cells were treated with 1 μg/mL of fluorescently-labeled Aβ42 in three different forms (oligomeric, aggregated, and fibrillary). Cells were harvested at 1 h and 3 h after the treatment and were analyzed by flow cytometry at 535 nm. Data are presented as mean ± SD and are quantified using a two-tailed Student’s t test. ns not significant; *P < 0.05; **P < 0. 01; ****P < 1.0 × 10⁻⁴. F Fluorescent intensity of fluorescently-labeled Aβ42 in HM WT cells and CTSH KO cells after the removal of the fluorescently-labeled Aβ42. Data are presented as mean ± SD. ns not significant; *P < 0.05; **P < 0. 01; ***P < 1.0 × 10⁻³; two-way ANOVA with the Tukey’s multiple comparisons test.

