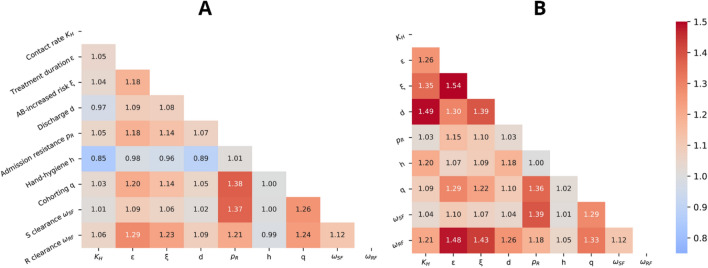
Figure 4.
Cooperation coefficient of paired parameters in case of their implementation (A) and reduction (B). The color scale (centered at CC = 1) goes from uncooperative effect (blue) to cooperative effect (red). KH: per-capita contact rate (daily contacts per HCW per patient); ε: treatment duration (LOS fraction); ξ: increased risk of acquiring resistance for antibiotic (AB) pressure; d: average discharge rate (inverse of LOS); pR: resistance prevalence at admission; h: hand hygiene compliance (probability of correct hand washing after contact); q: fraction of HCWs allocated to cohorting (removed from the population) ; ωSF: clearance rate of colonized by susceptible strains; ωRF: clearance rate of colonized by resistant strains.

