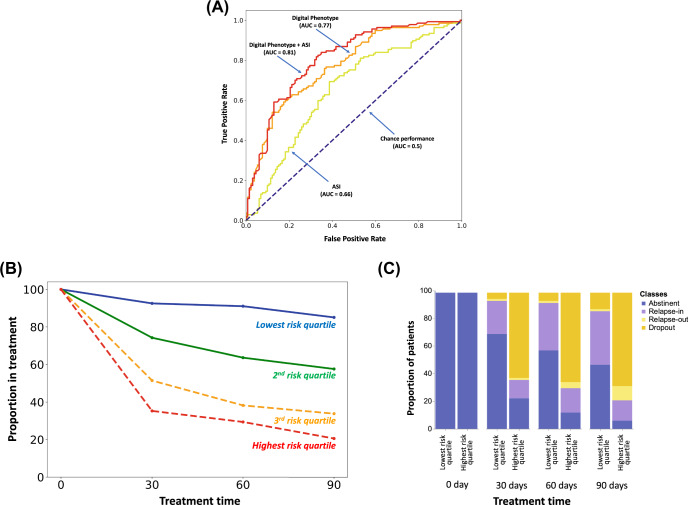
Fig. 4. Performance of our full risk assessment model which predicts the probability of dropout by 90 days.
A Receiver Operating Characteristic (ROC) Curve for model predictions of Dropout at 90 days; B Proportion in treatment by risk quartile; C Proportion of the four outcomes within the lowest risk and highest risk quartiles at 0, 30, 60, and 90 days of treatment.

