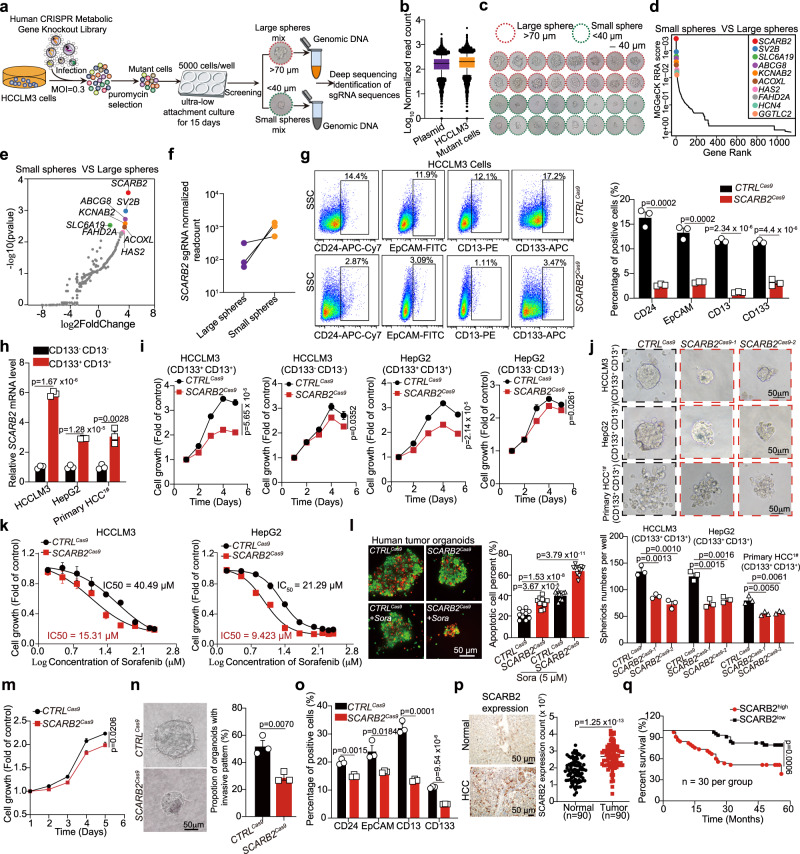
Fig. 1. CRISPR/Cas9 library screening identified SCARB2 as a positive modulator of stem cell-like characteristics of HCC cells.
a Schematic diagram illustrating the workflow for human CRISPR/Cas9 library screening. b The normalized read counts of all sgRNAs in CRISPR/Cas9 library plasmid (n = 29,957) and HCCLM3 cells infected with human CRISPR/Cas9 library (n = 29,875). The center line indicates the 50th percentiles; bounds of box = 25th–75th percentiles; whiskers = 10th–90th percentiles; minima: bottom whiskers; maxima: top whiskers. c Representative images of tumorspheres. large spheres (>70 µm); smaller spheres (<40 µm). d MAGeCK analysis and RRA ranking of top enriched genes in small tumorspheres compared to large tumorspheres. e Ranked dot plots of top enriched genes in small tumorspheres compared to large tumorspheres. P value was obtained by permutation test using Benjamini-Hochberg procedure by MAGeCK. f The normalized read counts of sgRNAs targeting SCARB2 between large tumorspheres and small tumorspheres. g Flow cytometric analysis of the proportion of CD24, EpCAM, CD13, or CD133 positive cells in CTRLCas9 or SCARB2Cas9 HCCLM3 cells. h Real-time PCR analysis of SCARB2 expression in CD133+ CD13+ and CD133- CD13- HCCLM3, HepG2 and primary HCC cells. i Cell growth curves of CD133+ CD13+and CD133- CD13- HCCLM3 and HepG2 cells with or without SCARB2 deletion. j Representative images of tumorspheres of indicated cells with or without SCARB2 knockout. The number of spheres was counted. Scale bar, 50 μm. k Effect of SCARB2 depletion on sorafenib sensitivity in HCCLM3 and HepG2 cells. The data are a summary of IC50 values for sorafenib. l Representative immunofluorescence images and quantification of the viability of HCC organoids with indicated treatment. Calcein acetoxymethyl (calcein-AM) was used to mark viable cells (green) and ethidium bromide homodimer-1 to mark dead cells (red) (n = 10 organoids per group). Scale bar, 50 μm. m Relative cell viabilities of tumor organoids with or without SCARB2 knockout. n Representative images and quantification of protrusive invasion of HCC organoids. Scale bar, 50 μm. o Flow cytometric analysis of the proportion of CD133, CD13, EpCAM or CD24 positive cells in HCC organoids with or without SCARB2 knockout. p IHC staining of SCARB2 expression in human normal liver tissues and HCC specimens (n = 90 per group). q Kaplan–Meier survival curves for patients with HCC stratified by SCARB2 expression. (g, h, i, j, k, m, n, o) n = 3 biological repeats. Statistical significance was calculated by (g, h, i, j, l, m, n, o, p) two-tailed Student’s t test; (q) two-sided log-rank test; Data are presented as means ± S.E.M. Source data are provided as a Source Data file.

