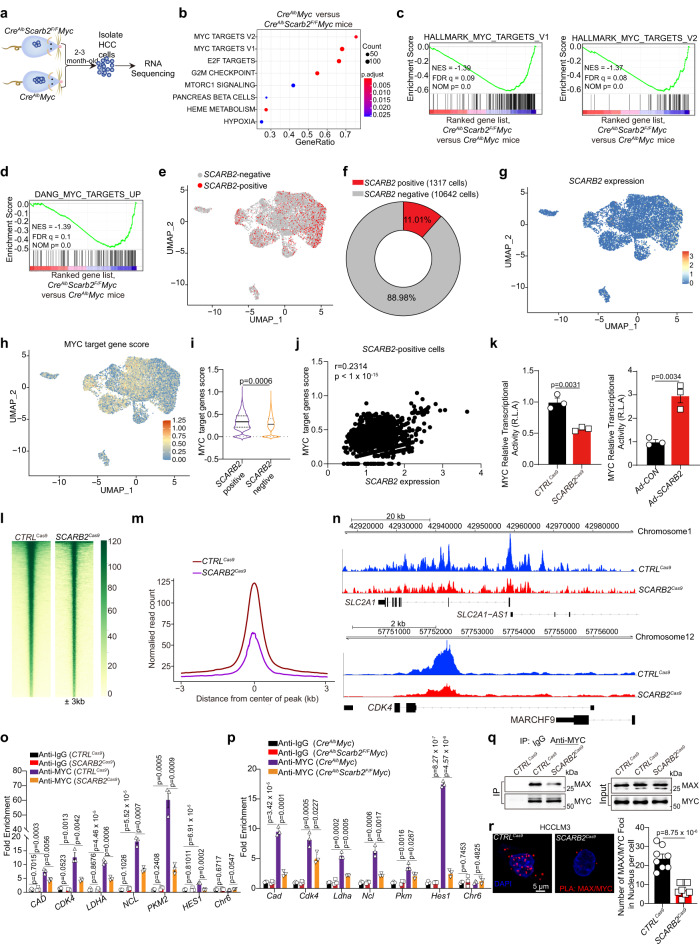
Fig. 3. SCARB2 deletion inhibits MYC transcriptional activity.
a Approaches for RNA-seq of HCC cells in the indicated groups. b The top Hallmark gene sets enriched in HCC cells from CreAlb Myc mice compared to CreAlbScarb2F/FMyc mice. P value was determined by one-sided permutation test. Statistical adjustments were made for multiple comparisons. c, d GSEA showing the enrichment of MYC target genes in CreAlbScarb2F/FMyc vs CreAlbMyc groups. P value was determined by one-sided permutation test. Statistical adjustments were made for multiple comparisons. e Visualization of SCARB2 positive and negative cells in tumorspheres by UMAP. f The proportion of SCARB2 positive cells in tumorspheres was analyzed by scRNA-seq. g, h Visualization of SCARB2 and MYC target genes expression in tumorspheres by UMAP. i Violin plot showing expression levels of MYC target gene score in SCARB2 positive and negative cells. The tips of the violin plot represent minima and maxima, and the width of violin plot shows the frequency distribution of data. j Correlation expression of MYC target genes and SCARB2 expression in SCARB2 positive cells. Each data point represents the value from an individual cell. k Effects of SCARB2 deletion or overexpression on the transcriptional activity of MYC. l Heatmap showing occupancy of genome-wide MYC peaks in CTRLCas9 and SCARB2Cas9 HCCLM3 cells in a ± 3 kb window surrounding the TSS. m Metagene plots of global MYC occupancy in gene bodies in CTRLCas9 and SCARB2Cas9 HCCLM3 cells. n CUT & tag tracks showing the binding of MYC to CDK4 and SLC2A1 in CTRLCas9 and SCARB2Cas9 HCCLM3 cells. o, p CTRLCas9 and SCARB2Cas9 HCCLM3 cells (o) or HCC cells from CreAlbMyc and CreAlbScarb2F/FMyc mice (p) were analyzed by ChIP with MYC or IgG antibody. ChIP’d DNA was quantified using qPCR for MYC or IgG binding to MYC target genes promoters. q Effect of SCARB2 knockout on the interaction MYC with MAX. Extracts of CTRLCas9 and SCARB2Cas9 HCCLM3 cells were IP anti-MYC Ab and blotted with an anti-MAX Ab. r Colocalization of MYC and MAX in CTRLCas9 and SCARB2Cas9 HCCLM3 cells was detected by the Duolink PLA assay. Data are representative images of MYC/MAX foci (left) and quantification of the number of fluorescent foci (n = 8 cells per group). Scale bar, 5 μm. k, o, p, q, r n = 3 biological repeats. Statistical significance was calculated by (i, k, o, p, r) two tailed Student’s t test; (j) two-sided Pearson’s correlation test; Data are presented as means ± S.E.M. Source data are provided as a Source Data file.

