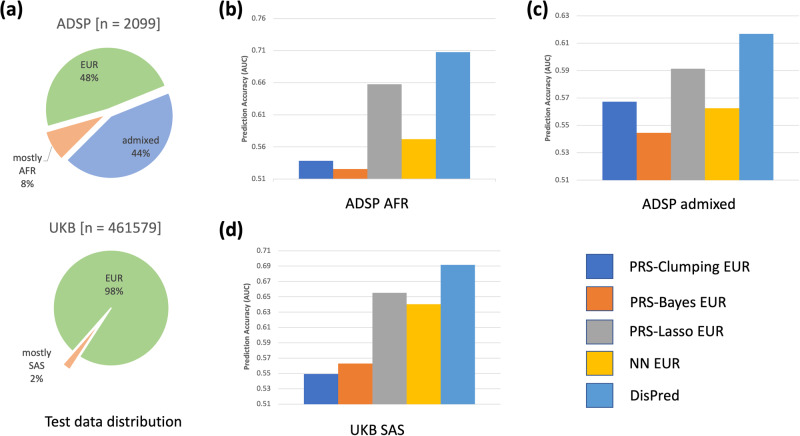
Fig. 3. Predictive analysis.
a Test data distribution for the ADSP and the UKB cohorts. The pie chart presents the proportion of different ancestries for the ADSP and the UKB. b Prediction accuracy (AUC) for different models trained on European participants (PRS-Clumping, PRS-Bayes, PRS-Lasso, Neural Network (NN)) and proposed DisPred trained on all data on different subsets of the test dataset: African participants (ADSP AFR), and c admixed individuals from ADSP cohort, and d South Asian participants (UKB SAS) from the UKB cohort.

