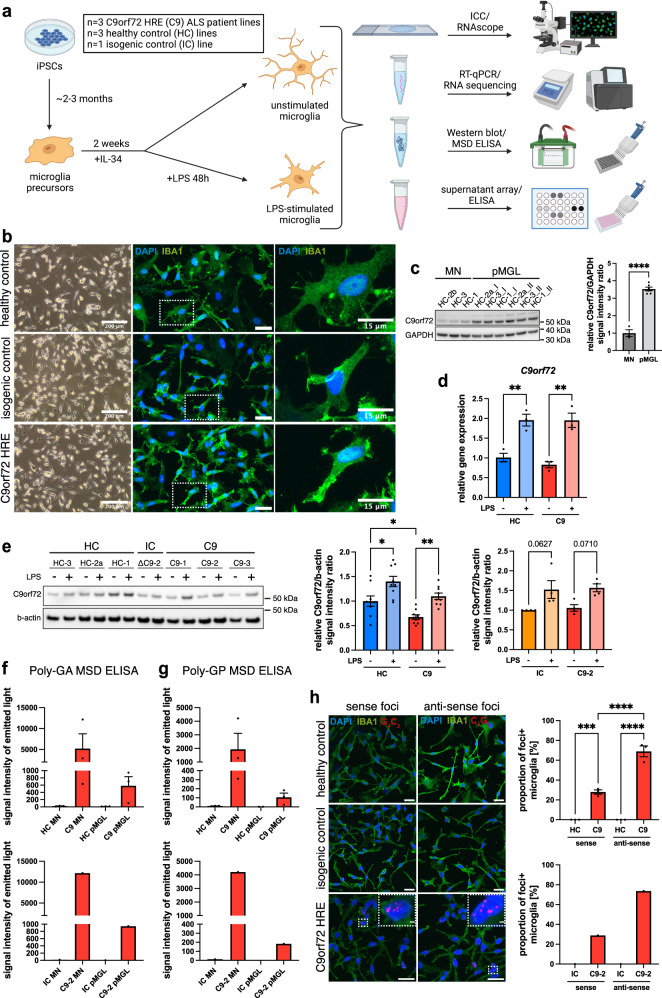
Fig. 1. C9orf72-ALS patient-derived iPSC microglia show key pathological features associated with the hexanucleotide repeat expansion in C9orf72.
a Schematic overview showing experimental setup and analyses performed on C9orf72 mutant (C9) iPSC-derived microglia in monoculture (pMGL) in this study, unstimulated or treated with LPS (100 ng/mL, 48 h). b Live cell (left) and immunofluorescent images (right, insets) of pMGL differentiated from healthy control (HC), isogenic control (IC), and C9 iPSC lines showing microglial morphology (images from one representative differentiation). Scale bars: 200 μm (left), 25 μm (right), 15 μm (insets). c Left: Western blot against C9orf72 comparing HC motor neurons (MNs) and pMGL. Right: Quantification normalized to the housekeeping gene GAPDH (n = 3 lines per cell type; n = 1 differentiation for MN, n = 2 differentiations for pMGL, indicated by I/II). d RT-qPCR for C9orf72 in unstimulated and LPS-primed pMGL normalized to the housekeeping gene TBP (n = 3 lines per condition, n = 1 differentiation). e Left: exemplar Western blot against C9orf72 in unstimulated and LPS-primed HC, IC, and C9 pMGL. Right: quantification normalized to the housekeeping gene b-actin. C9orf72 haploinsufficiency is found in C9 pMGL compared with HC (n = 3 lines per condition, n = 3 differentiations each) but not in the IC-C9-2 comparison (n = 1 line per condition, n = 3 differentiations each). f, g Analysis of Poly(GA)/Poly(GP) expression by MSD ELISA in HC, IC, and C9 MNs and pMGL. Both DPRs are detectable in C9 MNs and pMGL but not controls, while pMGL appear to have lower expression (n = 1 differentiation for n = 3 lines for top graphs, n = 1 line for bottom graphs). h Left: detection of nuclear sense (G4C2) and anti-sense (G2C4) RNA foci by RNAscope in C9 pMGL but not controls (n = 1 differentiation for n = 3 lines for top graph, n = 1 line for bottom graph). Scale bars: 25 μm, 2 μm (insets). Right: quantification showing anti-sense foci are more common than sense foci in C9 pMGL. Single data points and means ± SEM. *P < 0.05; **P < 0.01; ***P < 0.001; ****P < 0.0001. Two-tailed unpaired t-test (c). One-way ANOVA with Tukey’s post-hoc test (d, e, h). No statistical tests for f and g due to the small sample size with high variability. The graphics for panel a were created using Biorender.com. Source data are provided as a Source Data file.

