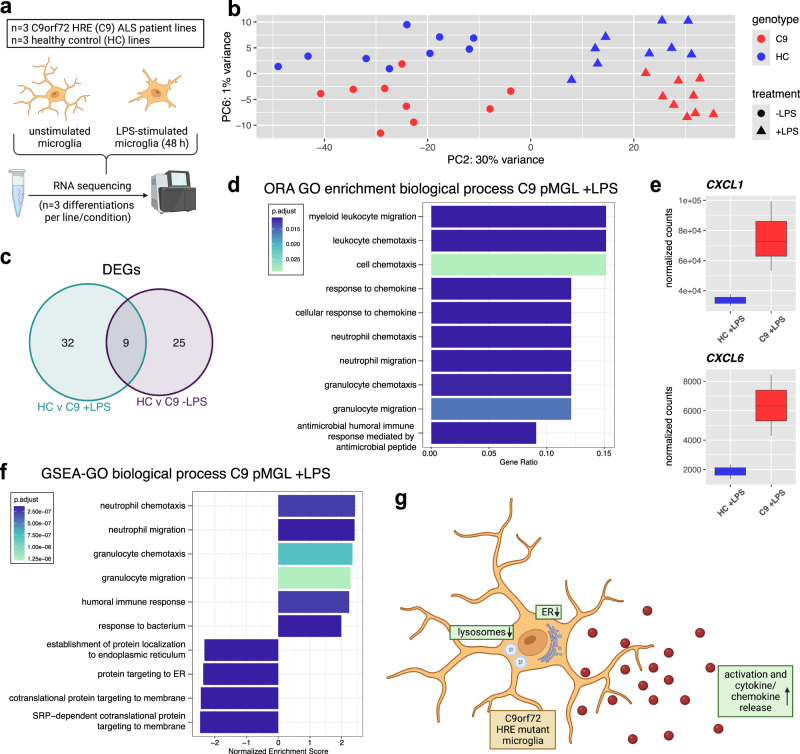
Fig. 2. RNA sequencing of C9orf72 mutant iPSC microglia identifies dysregulation of pathways associated with immune cell activation, cyto/-chemokines, lysosomes, and the ER.
a Schematic overview showing the experimental setup for RNA sequencing of C9orf72 mutant (C9) and healthy control (HC) iPSC-derived microglia in monoculture (pMGL), unstimulated or treated with LPS (100 ng/mL, 48 h). b Principal component analysis (PCA) plot based on the top 500 most variable genes with biggest variance in unstimulated and LPS-stimulated (100 ng/mL, 48 h) HC and C9 pMGL showing PC2 and PC6 (n = 3 lines per condition, n = 3 differentiations each), with response to LPS treatment on PC2 and separation of genotypes on PC6. For downstream analyses shown in this figure, the different differentiations for each line were merged. c Venn diagram showing differentially expressed genes (DEGs), defined as |log2 fc| > 0.5 and adjusted p-value < 0.05, and overlap for unstimulated and LPS-stimulated comparisons. d Bar plots showing top 10 significantly enriched GO biological process terms after over-representation analysis (ORA) using the clusterProfiler package for the DEGs between LPS-primed C9 and HC pMGL. x-axis showing Gene Ratio. The Benjamini-Hochberg corrected p-values for pathway enrichment for each term is indicated by the color of the bars. e Box plots of normalized counts from RNA seq analysis for CXCL1 and CXCL6, two DEGs in LPS-primed C9 pMGL versus HC (n = 3 lines per condition). Box plots show the median (center line), upper and lower quartiles (box limits), 1.5x interquartile range (whiskers), and outliers (points). f Bar plots showing top 10 significantly different GO biological process terms for LPS-stimulated C9 pMGL versus HC based on gene set enrichment analysis (GSEA) using the clusterProfiler package with the whole transcriptome ranked by log2fc. x-axis showing normalized enrichment score (NES). The Benjamini–Hochberg corrected p-values for pathway enrichment for each term is indicated by the color of the bars. g Summary schematic illustrating the pathways with most prominent enrichment in C9 pMGL in the RNA seq analysis. The graphics for panel a, g were created using Biorender.com.

