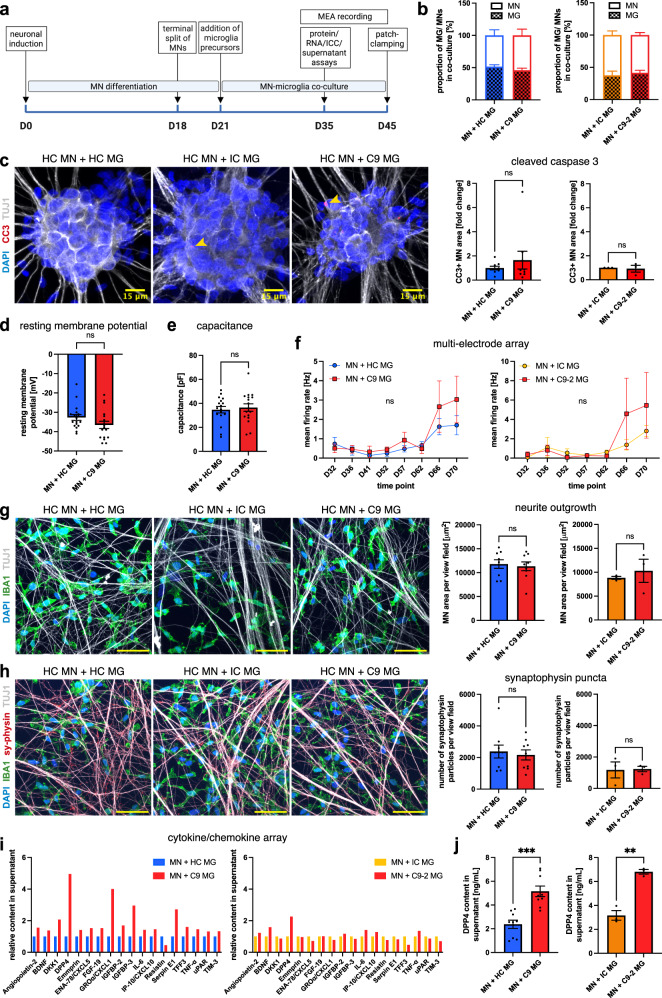
Fig. 4. Unstimulated C9orf72 mutant iPSC microglia do not cause overt toxicity to co-cultured healthy motor neurons but show an altered cytokine profile and upregulate DPP4 release.
a Experimental setup for motor neuron (MN)-microglia (MG) co-culture. b Percentage of MNs/MG in co-cultures of healthy control (HC) MNs and HC, isogenic control (IC), and C9orf72 mutant (C9) MG showing a ~ 1:1 ratio (n = 3 microglial lines (C9-HC comparison), n = 1 microglial line (IC-C9-2 comparison), n = 3 differentiations). c Left: Exemplar images showing the apoptosis marker cleaved caspase 3 (CC3) in HC MNs in co-culture with MG. Scale bars: 15 μm. Right: Quantification of relative fold change of CC3 expression (n = 3 microglia lines (C9-HC comparison), n = 1 microglial line (IC-C9-2 comparison), n = 3 differentiations). d, e Patch clamping analysis of resting membrane potential and capacitance of HC MNs in co-culture with MG (datapoints are single MNs from co-cultures with n = 3 microglial lines (d, +HC: n = 18, +C9: n = 17; e, both n = 17), n = 1 differentiation). f Multi-electrode array analysis (MEA) of mean firing rate of HC MNs in co-culture with MG (n = 3 microglial lines (C9-HC comparison), n = 1 microglial line (IC-C9-2 comparison), n = 2 wells per n = 3 differentiations). g Left: exemplar images of neurites of HC MNs in co-culture with MG. Right: quantification of neurite outgrowth (n = 3 microglial lines (C9-HC comparison), n = 1 microglial line (IC-C9-2 comparison), n = 3 differentiations). Scale bars: 50 μm. h Left: exemplar images of synaptophysin (sy-physin) staining in co-culture of HC MNs with MG. Right: quantification of the number of synaptophysin particles (n = 3 microglial lines (C9-HC comparison), n = 1 microglial line (IC-C9-2 comparison), n = 3 differentiations). Scale bars: 50 μm. i Relative fold change in co-culture supernatant for selected targets using a cytokine array (pooled from co-cultures of HC MNs with n = 3 microglial lines (C9-HC comparison), n = 1 microglial line (IC-C9-2 comparison), n = 3 differentiations). j ELISA quantification of DPP4 in co-culture supernatants from HC MNs and MG (n = 3 microglial lines for C9-HC comparison, n = 1 microglial line for IC-C9-2 comparison, n = 3 differentiations). Single data points and means ± SEM. **P < 0.01; ***P < 0.001; ns not significant. Two-tailed unpaired t-test (c–e, g, h, j), two-way ANOVA with Tukey’s post-hoc test (f). The graphics for panel a were created using Biorender.com. Source data are provided as a Source Data file.

