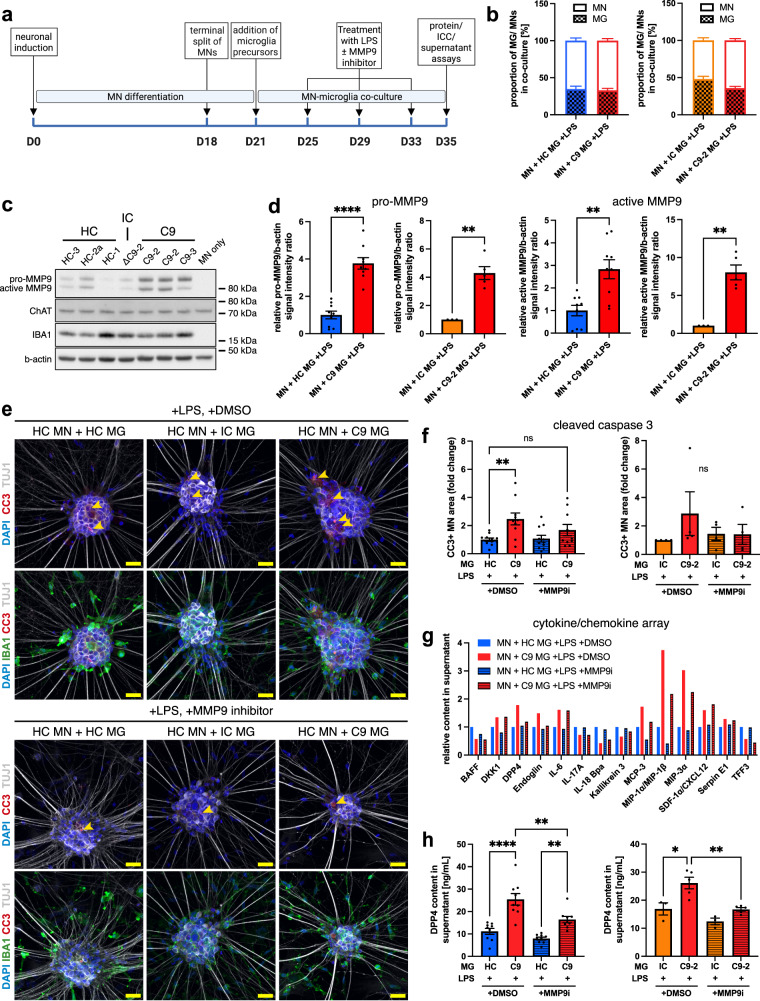
Fig. 5. LPS-stimulated C9orf72 mutant iPSC microglia increase apoptotic marker expression in co-cultured healthy iPSC motor neurons and upregulate DPP4 release via an MMP9-dependent mechanism.
a Experimental setup for LPS-stimulated motor neuron (MN)-microglia (MG) co-cultures. b Percentage of MNs/MG in LPS-stimulated co-cultures of healthy control (HC) MNs and HC, isogenic control (IC), and C9orf72 mutant (C9) MG showing a ~ 30% microglia content (n = 3 microglial lines, n = 4 differentiations (C9-HC comparison), n = 1 microglial line, n = 5 differentiations (IC-C9-2 comparison)). c Exemplar Western blot against IBA1, ChAT, and MMP9 in LPS-stimulated co-cultures of HC MNs with MG. d Quantification of blot shown in c demonstrating pro-MMP9 and active MMP9 normalized to the housekeeping gene b-actin are significantly increased in LPS-stimulated co-cultures of HC MNs with C9 MG compared with controls (n = 3 microglial lines (C9-HC comparison), n = 1 microglial line (C9-2-IC comparison), n = 3 differentiations). e Exemplar images of apoptosis marker cleaved caspase 3 (CC3) in HC MNs in LPS-primed co-cultures with MG plus MMP9 inhibitor 1 (3 μM, MMP9i) or DMSO as vehicle control. Scale bars: 25 μm. f Quantification showing significantly increased relative fold change in CC3 expression in LPS-primed co-cultures with C9 MG compared with HC MG. Administration of MMP9i ameliorates microglial neurotoxicity. The C9-2-IC comparison shows the same pattern but does not reach statistical significance (n = 3 microglial lines, n = 4 differentiations (C9-HC comparison, n = 1 microglial line, n = 4 differentiations (IC-C9-2 comparison)). g Relative fold change in LPS-stimulated co-culture supernatant for selected targets using a cytokine array. Supernatant samples from LPS-primed co-cultures of HC MNs with C9 MG showing a dysregulated cytokine profile compared with HC MG, which is ameliorated by MMP9i treatment (pooled samples from n = 3 microglial lines with n = 3 differentiations each). h ELISA quantification of DPP4 in co-culture supernatants from LPS-stimulated co-cultures of HC MNs and MG showing significantly increased DPP4 levels, which is significantly reduced after MMP9i treatment (n = 3 microglial lines (C9-HC comparison), n = 1 microglial line (IC-C9-2 comparison), n = 3 differentiations). Single data points and means ± SEM. *P < 0.05; **P < 0.01; ****P < 0.0001; ns: not significant. Two-tailed unpaired t-test (d) and one-way ANOVA with Tukey’s post-hoc test (f, h). The graphics for panel a were created using Biorender.com. Source data are provided as a Source Data file.

