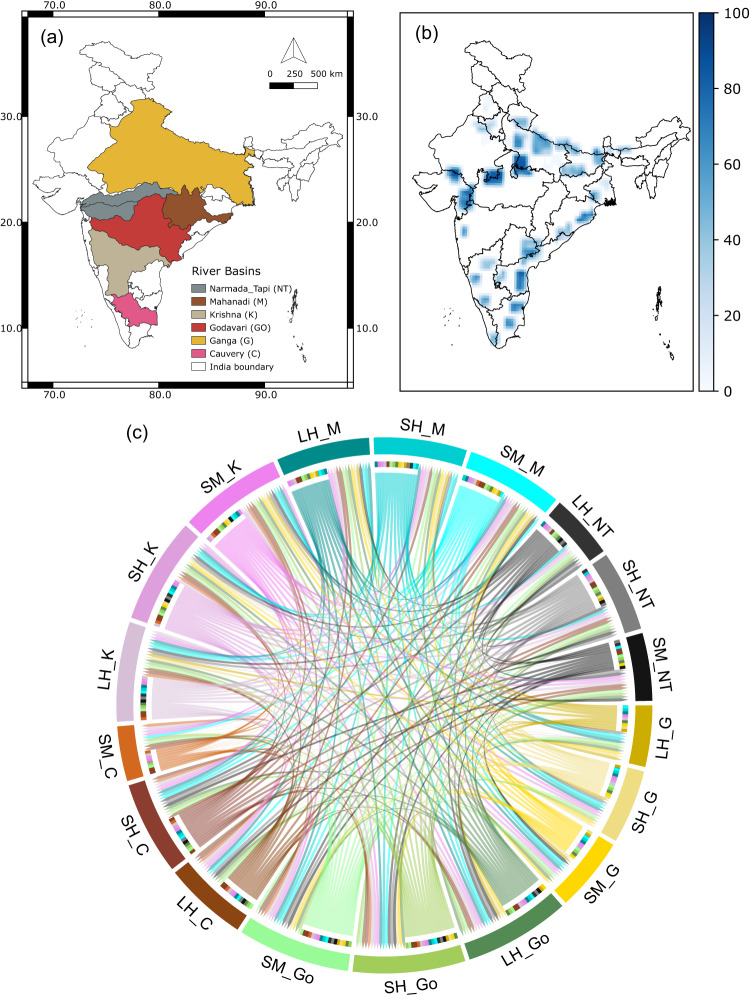
Fig. 1. Connections between land variables of different river basins.
a River Basins in India considered in the study. b Irrigated grid cells under river interlinking schemes showing change in percentage irrigated area from control run (CTL) to irrigation run (IRR) run (see “Methods”) to increase irrigated area fraction to 80%. c Network between land variable across river basins generated using the algorithm PCMCI (ParCorr). Sectors are labeled as variable symbols (soil moisture-SM, latent heat flux-LH, sensible heat flux-SH) followed by the basin they belong to (Ganga (G, 808,334 km2), Godavari (Go, 302,063 km2), Mahanadi (M, 139,659 km2), Krishna (K, 254,743 km2), Narmada-Tapi (NT, 98,796 km2, 65,145 km2, respectively—two river basins taken together), and Cauvery (C, 85,624 km2)). Links are only shown if found statistically significant at 99% confidence and are colored same as the node they originate from. For example, link from LH_G to LH_M shows that there is a connection between latent heat fluxes from Ganga and Mahanadi basin. Ratio of incoming to outgoing links in Cauvery basin is very high compared to Ganga and Narmada-Tapi basin.

