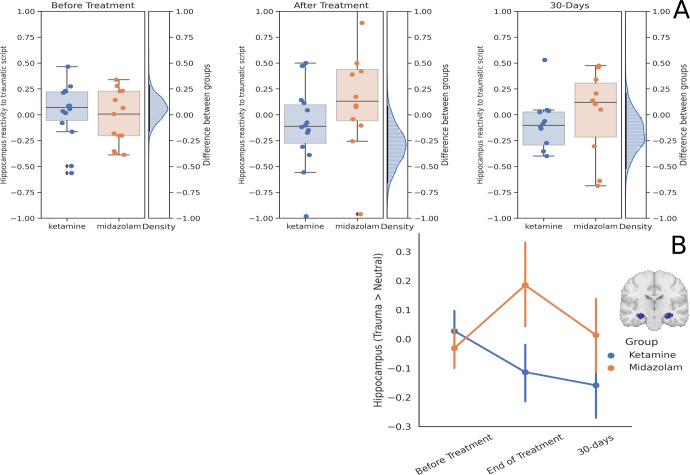
Fig. 3. Hippocampus Reactivity.
A Differences between the ketamine and midazolam groups in hippocampus reactivity to trauma vs. relax scripts across the three time points. Each dot is a participant, the horizontal line in the middle of the boxplot represents median. On the right of each panel is the posterior distribution of the difference between the groups. The black line is the 95% HDI. B Average hippocampus reactivity to trauma vs. relax in the ketamine group (blue) and the midazolam group (orange) in the three time points. Error bars represent standard error of the mean. Brain image depicts the mask of the hippocampus ROI (center: MNI [−28,−18,−16], [28,−18,−16]).

