Figure 2.
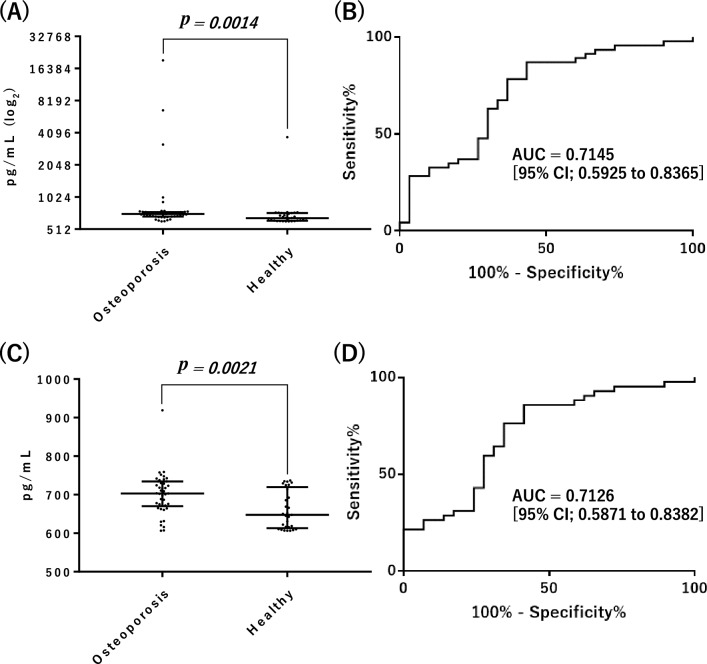
Serum levels and ROC curves of Pvalb, as determined by ELISA. (A) Left, in 46 osteoporosis patients, the median serum level [interquartile range, IQR] of Pvalb was 709.8 [672.7–739.3] pg/mL. Right, in 30 healthy subjects, the median serum level [IQR] of Pvalb was 649.0 [616.0–722.3] pg/mL. Horizontal bars represent the median and IQR. (B) ROC curve for discriminating between patient groups. “AUC” indicates the area under the ROC curve [95% CI]. (C) Pvalb serum levels derived using samples excluding those from four patients and one healthy subject with particularly high levels of Pvalb (> 1 ng/mL). Left, in 42 osteoporosis patients, the median serum level [IQR] of Pvalb was 703.2 [671.7–733.2] pg/mL. Right, in 29 healthy subjects, the median serum level [IQR] of Pvalb was 647.6 [615.8–714.4] pg/mL. Horizontal bars represent the median and IQR. (D) ROC curve for discriminating patient groups, excluding results of samples from four patients and one healthy subject with particularly high levels of Pvalb (> 1 ng/mL). “AUC” indicates the area under the ROC curve [95% CI].

