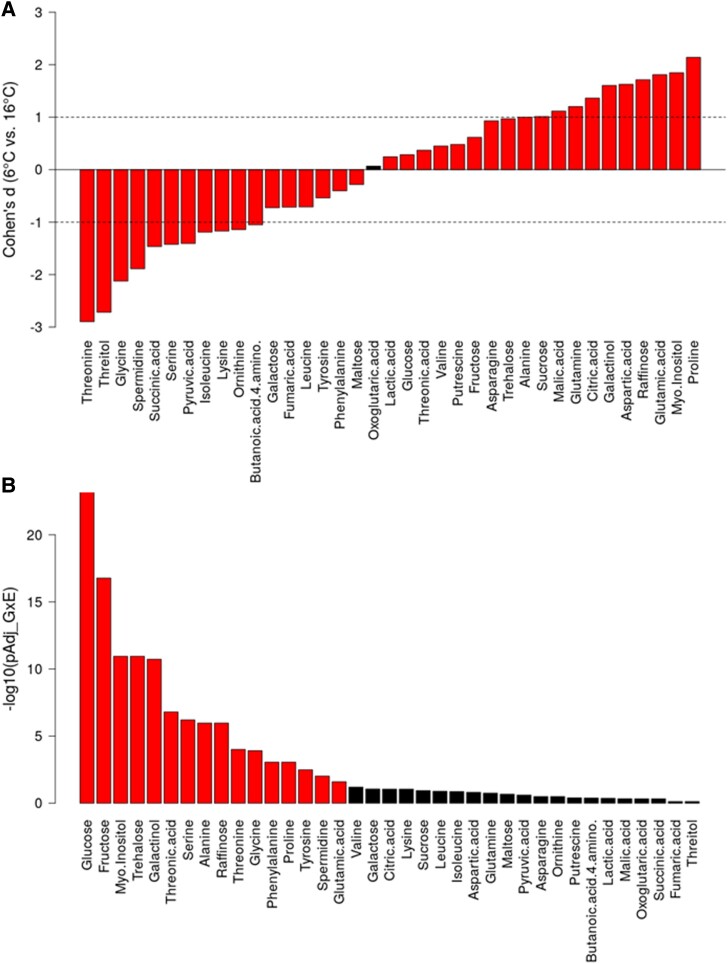
Figure 1.
Effects of growth temperature on primary plant metabolism. A) Differential metabolite levels captured by effect size (Cohen's d) for the 37 metabolites at 6 °C and 16 °C, respectively, considered in this study. Metabolite levels were taken as normalized absolute levels as explained in Materials and Methods. Based on t-tests, all but one (oxoglutarate) differences were significant (PFDR < 0.05). Note: Cohen's d can be roughly interpreted as the difference of the mean values (levels at 6 °C minus levels at 16 °C) normalized by the average of the respective standard deviations. Absolute Cohen's d values exceeding “1” (dashed lines) can be regarded as large effects. B) Interaction effects, accessions (genotype, G) × temperature (=environment, E) from a two-way ANOVA analysis with an interaction term. Color indicates significance, red PFDR < 0.05, black otherwise. FDR-adjusted P values are displayed as their -log_base10 transformed values. Note, except 4-amino-butanoic acid, all metabolites were found significantly different across the 241 different accessions (ANOVA PFDR for accession, i.e. genotype effect alone). Statistical tests were performed using all individual samples (Ntot = 1,624 with N16 °C = 817 and N6 °C = 807), i.e. normalized, but not averaged per accession.

