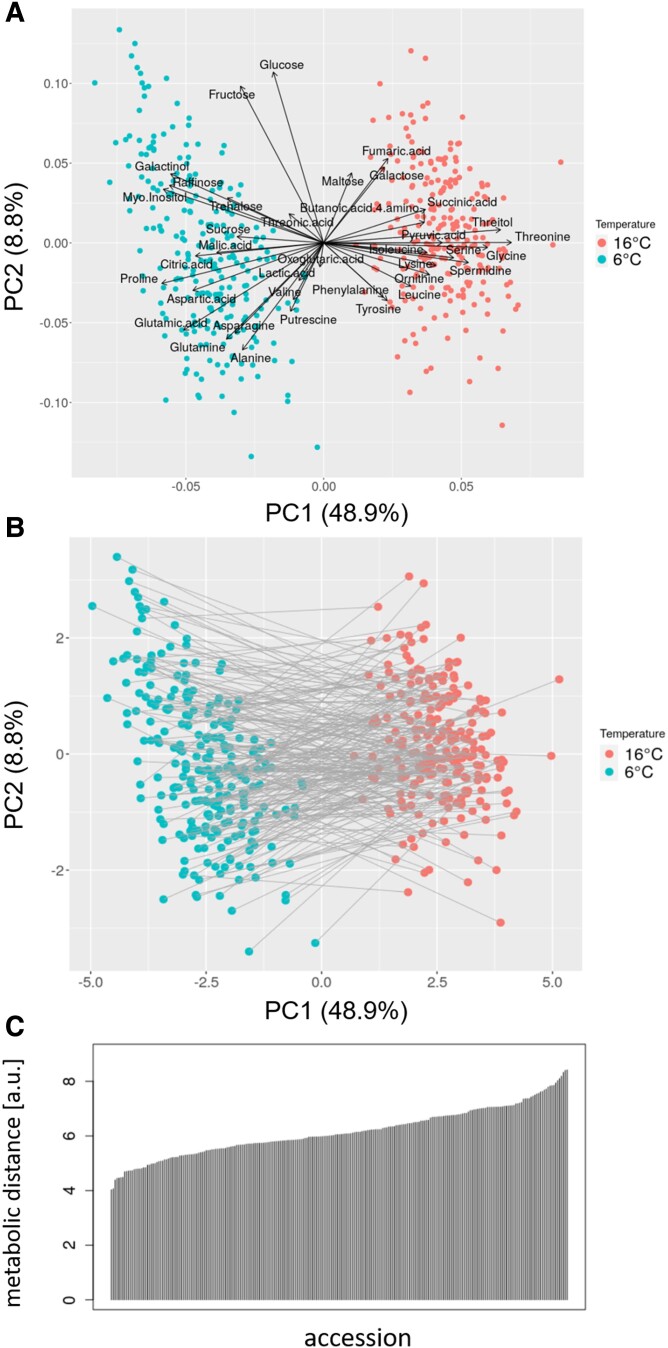
Figure 2.
PCA and illustration of MDs. A) Scaled PCA biplot of the first two principal components (PC 1 and 2), with points corresponding to the scores of the 241 accessions exposed to the two growth temperature conditions and arrows signifying the respective 37 metabolite loadings. Here, every combination of accession and treatment corresponds to the profile of mean normalized metabolite levels, i.e. repeat-averaged samples. Percentages in parentheses denote the variance captured by the respective PC. B) PCA score plot with gray line segments and their respective lengths denoting the MDs calculated as the Euclidean distance of metabolite profiles between samples of the same accession exposed to the two different growth temperatures (Eq. 1). Note, unlike in Fig. 1A, scores are not scaled and MDs are computed in this unscaled value range respectively, i.e. the score plot corresponds to a rotation in the 37-dimensional Euclidean space to align with PC 1 and 2. C) Overview of the distribution and range of MD values across all 241 accessions.

