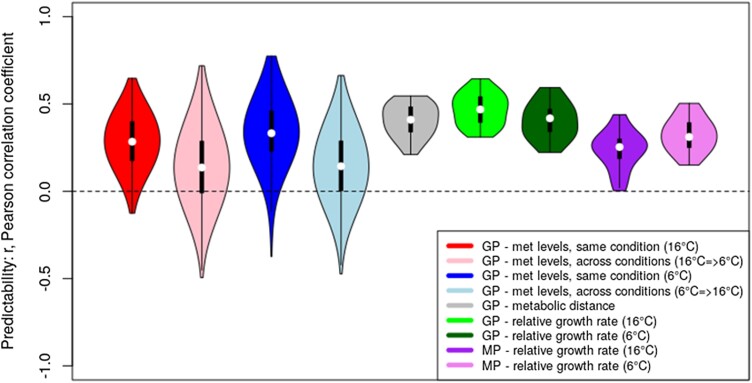
Figure 3.
Predictability of metabolite levels, MDs, and RGRs as measured by the Pearson correlation coefficient, r, of predicted versus observed values in a cross-validation setting and performing rrBLUP predictions. GP, genomic prediction, i.e. predictor variables = SNP-matrix (16,544 unique SNPs); MP, metabolic prediction, i.e. 37 input metabolite levels. With regard to metabolite (met) levels, all 37 measured metabolites were considered target variables predicted by rrBLUP using a regression model derived from a training set of 180 randomly chosen accessions and applied to the remaining 61 accessions; likewise, MD, and growth rate (at T = 6 °C and 16 °C) were taken as target variables as well. “Same condition” refers to the situation of training a regression model at a given temperature and applying it to the test set samples of the same conditions, whereas “across conditions” tests for the predictability of metabolite levels of the respective other temperatures regime. Distributions were obtained from 25 repeat runs of random 180-training/61-test set accessions. Note that for metabolites, this was done separately for each metabolite and condensed into one distribution for all 37 metabolites per test condition (four “GP- met levels” distributions). Violin plots display the characteristics of the respective distributions: median (open circle), 25 to 75 percentile range (black rectangle) and range excluding outliers (vertical line).

