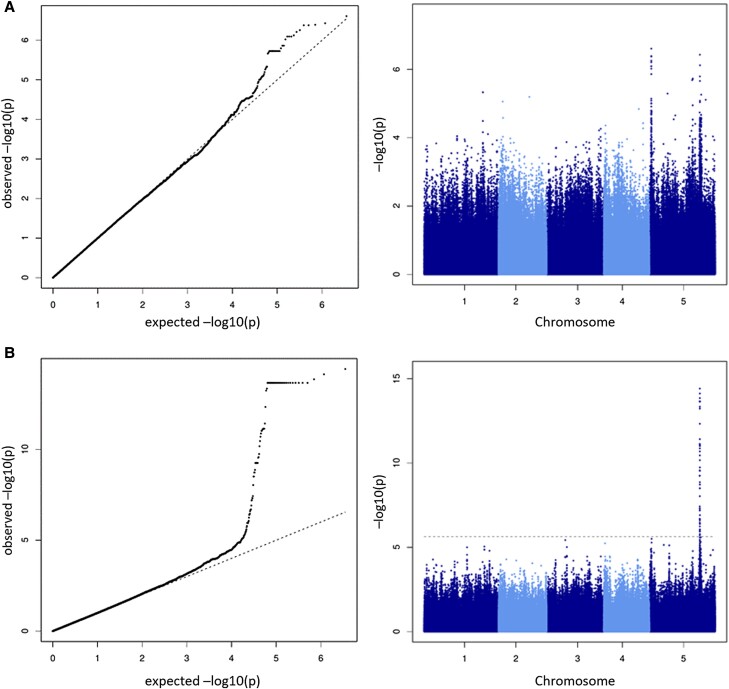
Figure 5.
Metabolic GWAS of fumarate levels. A) Growth temperature 16 °C, and B) growth temperature 6 °C. Left panels: qq-plot, right panels: Manhattan plot, where the dashed horizontal line indicates FDR threshold of FDR = 0.05, the peak (T = 6 °C) on chromosome 5 corresponds to the locus of the FUM2 gene. Please note the difference in y value range between the two graphs. qq- and Manhattan plots of all other metabolites under both temperatures are provided in the Supplemental Data Set 2.

