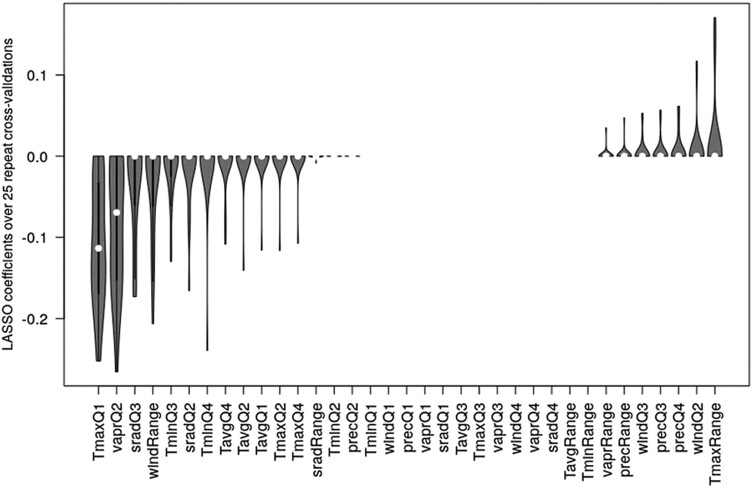
Figure 8.
Lasso regression coefficients with MD as the target variable and scaled climate parameters as independent predictor variables. Violin plots over 25 cross-validation runs (180 training, 59 testing, randomly selected in every run). Note, for two accessions, no climate parameters were available. The regularization parameter lambda was determined in each of the repeats in a separate cross-validation using the respective training accessions only and taken as the value associated with the minimum error. “Range” refers to the annual range of the respective variable (max–min of quarterly values). T, temperature (maximal, average, and minimal), vapr, water vapor pressure; srad, solar radiation; prec, precipitation; wind, wind; Q, quarter. Violin plots display the characteristics of the respective distributions: median (open circle), 25 to 75 percentile range (black rectangle), and range excluding outliers (vertical line).

