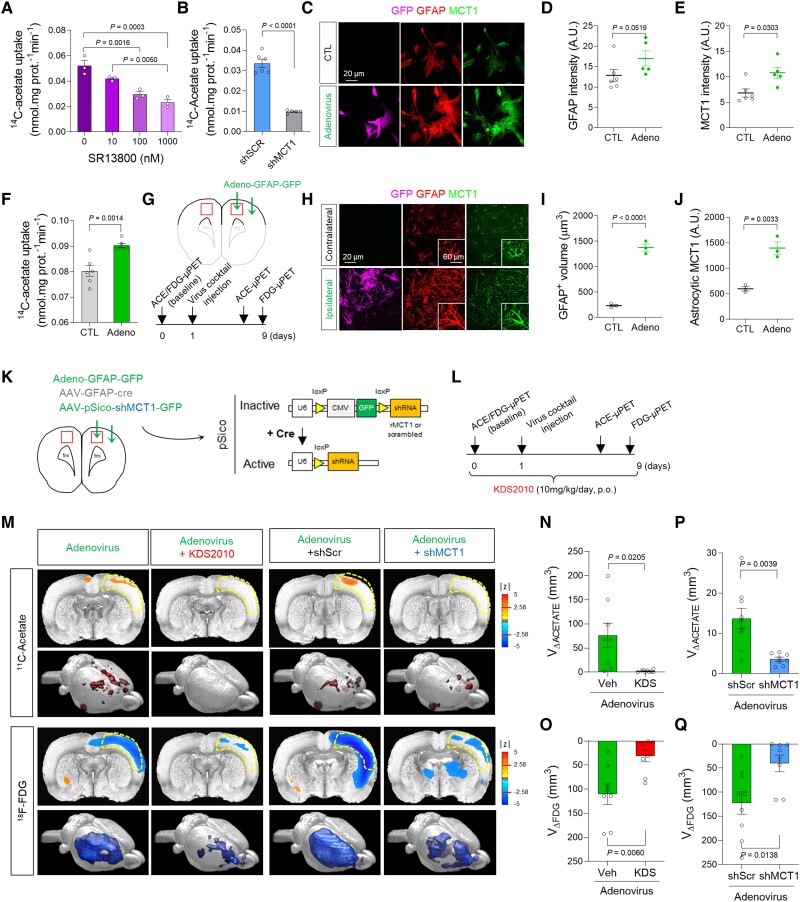
Figure 1.
MCT1-mediated acetate hypermetabolism and glucose hypometabolism in the adenovirus-induced reactive astrogliosis model. (A and B) Blockade effect of SR13800 (A) or Mct1 gene-silencing (B) on 14C-acetate uptake in primary cultured astrocytes. (C) Representative images displaying GFAP and MCT1 expressions in primary cultured astrocytes 48 h after adenovirus treatment. (D and E) Quantification of GFAP and MCT1 immunoreactivity (n = 6 and 5 replicates for CTL and Adeno groups, respectively). (F) The adenovirus effect on 14C-acetate uptake. (G) Schematic diagram of in vivo micro-PET imaging of adenovirus model. (H) Representative images displaying GFAP and MCT1 expressions in adenovirus model. (I and J) Quantification of the cell volume (I) and MCT1 expression (J) of GFAP-positive cells (n = 3 rats). (K) Schematic diagram of virus injection for astrocyte-specific Mct1 gene-silencing. (L) Timeline of PET imaging schedule. (M) Left: Parametric images from voxel-based comparison of 11C-acetate and 18F-FDG PET imaging in adenovirus model with or without KDS2010 treatment. Right: Parametric images from voxel-based comparison of 11C-acetate and 18F-FDG PET imaging in adenovirus model with scrambled-shRNA or MCT1-shRNA. (N and O) Quantification of the volume of increased 11C-acetate uptake (n = 8 and 9 rats for vehicle and KDS2010 groups, respectively). (P and Q) Quantification of the volume of decreased 18F-FDG uptake (n = 9 and 8 rats for shScr and shMct1 groups, respectively). Mean ± SEM. Significance was assessed by one-way ANOVA with Tukey (A), Mann-Whitney test (D, E, I and J), or two-tailed unpaired Student’s t-test with Welch’s correction (F, N and O) or without Welch’s correction (P and Q).

