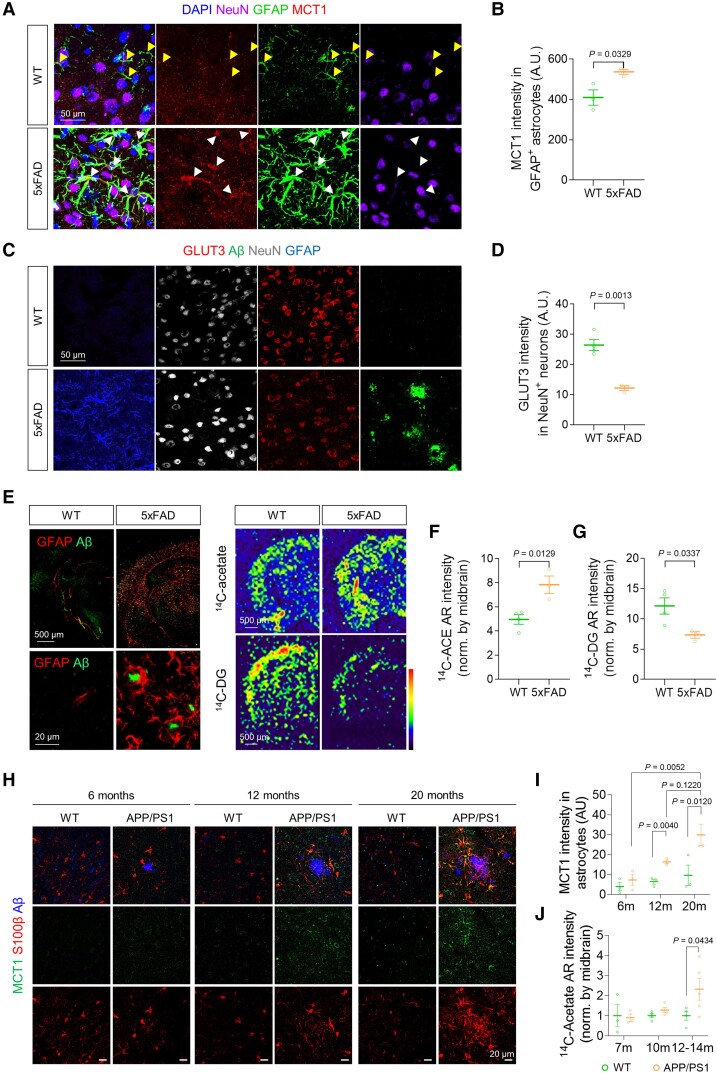
Figure 3.
Increased MCT1 and reduced GLUT3 are associated with acetate hypermetabolism and glucose hypometabolism in AD mice. (A) Representative images displaying GFAP and MCT1 expressions in the cortex of 5xFAD mice. (B) Quantification of astrocytic MCT1 immunoreactivity (n = 3 mice for each group). (C) Representative images displaying NeuN and GLUT3 expressions in the cortex of 5xFAD mice. (D) Quantification of neuronal GLUT3 immunoreactivity (n = 3 mice for each group). (E) Top: Representative images displaying Aβ-plaque and GFAP expressions in 5xFAD mice. Bottom: Representative autoradiographic images of 14C-acetate and 14C-DG. (F and G) Quantification of 14C-acetate and 14C-DG (n = 4 and 3 mice for WT and 5xFAD, respectively). (H) Representative confocal images of MCT1 and S100b in 6-, 12- and 20-month-old (m) APP/PS1 transgenic mice. (I) Quantification of S100b-positive astrocytic MCT1 expression (n = 3 for each group). (J) Quantification of 14C intensity (n = 3, 3, 4, 4, 4 and 5 mice for 7 m WT, 7 m APP/PS1, 10 m WT, 10 m APP/PS1, 12–14 m WT, and 12–14 m APP/PS1, respectively). Mean ± SEM for bar graphs. Median and quartiles for violin plots. Significance was assessed by two-tailed unpaired Student’s t-test (B, D, F and G), Two-way ANOVA with Tukey (I), or Two-way ANOVA with Sidak (J).

