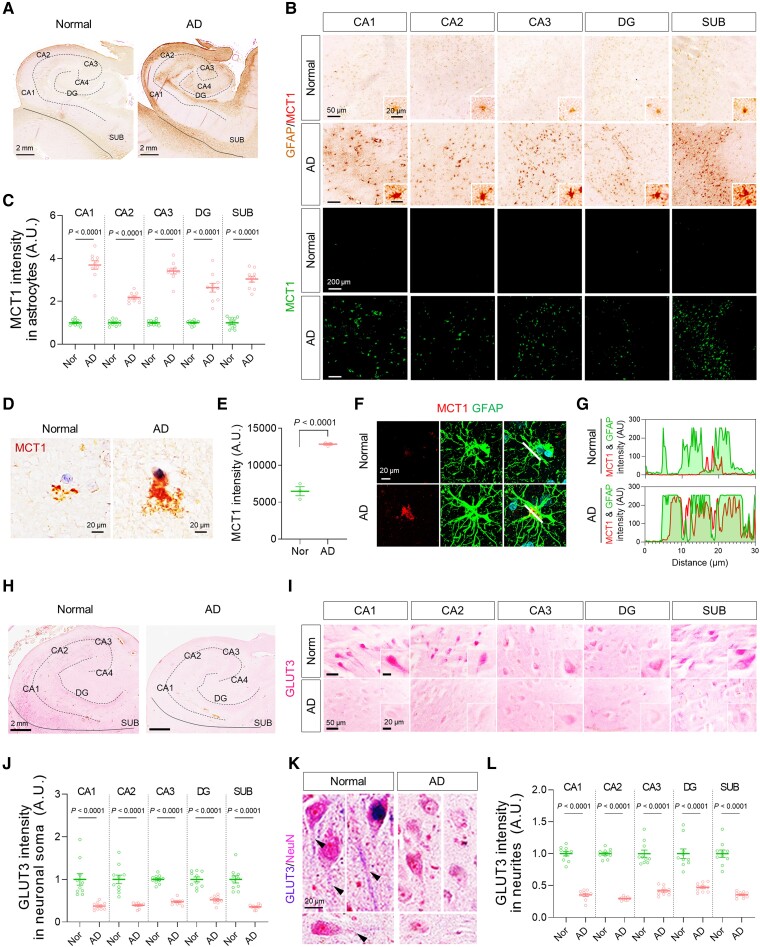
Figure 5.
Astrocytic MCT1 is increased while neuronal GLUT3 is decreased in the hippocampus of AD patients. (A and B) Representative images of double-staining of GFAP and MCT1 in post-mortem hippocampal tissues from normal subjects (n = 10) and AD post-mortem brains (n = 10). (C) Quantification of astrocytic MCT1 intensity in each hippocampal sub-region. (D) Representative images of MCT1 immunoreactivity in the cortex of normal subject and AD patient. (E) Quantification of MCT1 intensity in the cortex of normal subjects (n = 3) and AD patients (n = 3). (F) Representative images of double-staining of MCT1 (red) and GFAP (green) in the cortex of normal subject and AD patient. (G) Co-localization analysis of MCT1 and GFAP signals in the cortex of normal subject and AD patient. White lines in merged images were drawn to measure the space cross-correlation of MCT1 and GFAP signals. (H and I) Representative images of single-staining of GLUT3 in neuronal soma of post-mortem hippocampal tissues from normal subjects (n = 10) and AD post-mortem brains (n = 10). (J) Quantification of GLUT3 intensity in neuronal soma. (K) Representative images of double-staining of NeuN and GLUT3 in neurites. (L) Quantification of GLUT3 intensity in neurites. Mean ± SEM. Significance was assessed by two-tailed unpaired Student’s t-test (E), Mann-Whitney test (J, CA1, CA2, DG and SUB; L, SUB) or two-tailed unpaired Student’s t-test with Welch’s correction (others).

