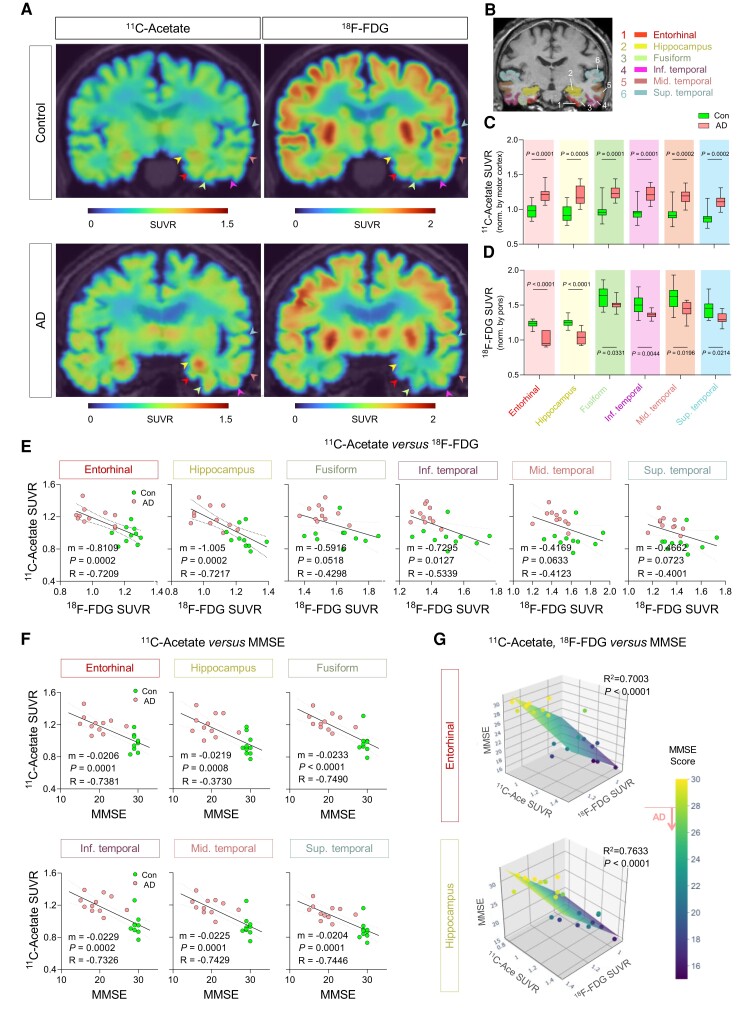
Figure 6.
11C-acetate and 18F-FDG PET imaging for visualizing reactive astrogliosis and the associated neuronal glucose hypometabolism in AD patients’ brains. (A) Representative PET images of 11C-acetate and 18F-FDG in control and AD patients. (B) ROIs from an MR image. The ROI colours are matched with arrowheads in A. (C and D) Quantification of 11C-acetate and 18F-FDG SUVR in each ROI of control (n = 10) and AD patients (n = 11). (E) Correlation between 11C-acetate SUVR and MMSE scores. (F) Multiple correlations between 11C-acetate SUVR, 18F-FDG SUVR in entorhinal cortex and hippocampus, and MMSE scores. The multiple correlations in the fusiform, inferior, middle and superior temporal gyrus are displayed in Supplementary Fig. 7B. Mean ± SEM. Significance was assessed by two-tailed unpaired Student’s t-test (C and D), linear regression (E), or multiple linear regression (F) with Pearson’s correlation.

