Figure 6.
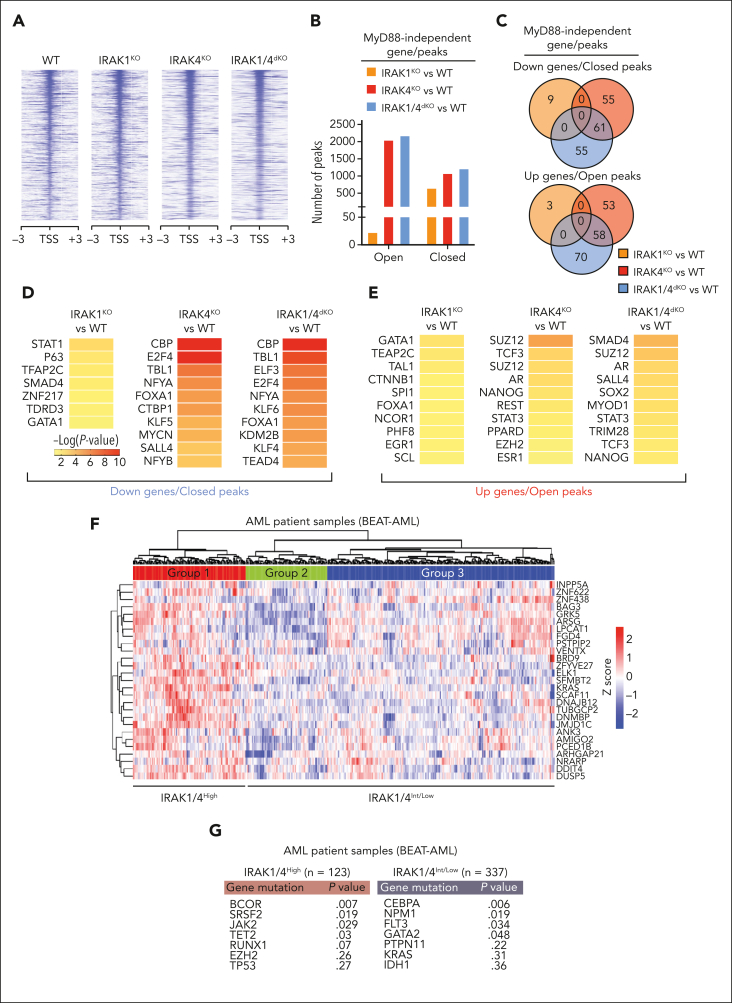
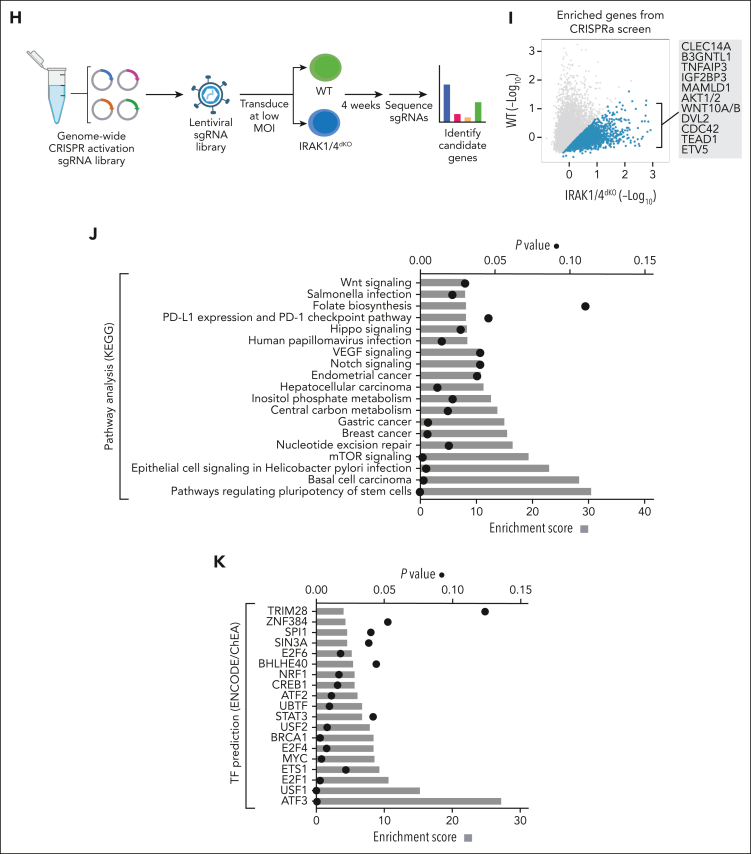
IRAK1/4 maintains undifferentiated leukemic cell states through chromatin and transcription factor networks. (A) Heatmap of chromatin accessibility (assay for transposase-accessible chromatin sequencing) peaks within a 3 kb distance of transcription start sites of genes in WT, IRAK1KO, IRAK4KO, and IRAK1/4dKO THP1 cells. (B) The total number of accessibility peaks lost and acquired in IRAK1KO, IRAK4KO, and IRAK1/4dKO THP1 relative to WT cells. (C) Venn diagrams of overlap genes that are associated with both differential expression (RNA sequencing) and concordant changes in chromatin accessibility (assay for transposase-accessible chromatin sequencing) in IRAK1KO, IRAK4KO, and IRAK1/4dKO THP1 cells. (D-E) Heatmaps of transcription factor enrichment among genes associated with the downregulation and loss of chromatin peaks (D) or the upregulation and acquisition of open chromatin peaks (E) in IRAK1KO, IRAK4KO, and IRAK1/4dKO THP1 cells relative to WT cells. Enrichment of transcription factor signatures was determined with the Chromatin Immunoprecipitation (ChIP) Enrichment Analysis (ChEA) 2022 library. Color intensity reflects the Log (P value) of the enrichment score. (F) Heatmap of differential gene expression in patients with AML (relative to healthy controls) using gene expression data curated from the Beat AML data set. The heatmap represents a subset of genes that are downregulated and associated with the loss of chromatin accessibility in IRAK1/4dKO THP1 (IRAK1/4 gene signature). Unsupervised hierarchical clustering analysis resolved distinct cohorts of IRAK1/4-high signature (Group 1) and IRAK1/4-low/intermediate signature (Groups 2 and 3) patients with AML. (G) Enrichment of AML-associated mutations in IRAK1/4-high signature (Group 1) and IRAK1/4-low/intermediate signature (Groups 2 and 3) Patients with AML (from panel F) based on hypergeometric testing. (H) Schematic diagram of the CRISPR activation screen. WT and IRAK1/4dKO THP1 cells were transduced with the pooled sgRNA library targeting more than 18 000 coding isoforms. After 3 weeks, deep sequencing was performed to identify candidate genes. (I) Average Model-based Analysis of Genome-wide CRISPR-Cas9 Knockout (MAGeCK) score for candidate genes from WT and IRAK1/4dKO THP1 replicate samples. Blue circles represent genes selectively enriched in IRAK1/4dKO THP1 cells. (J) Most significant pathways (KEGG analysis) selectively enriched in IRAK1/4dKO THP1 cells among the top 438 candidate genes (based on fold change and P value). (K) Most significant transcription factors (ENCODE/ChEA analysis) selectively enriched in IRAK1/4dKO THP1 cells among the top 438 candidate genes.


