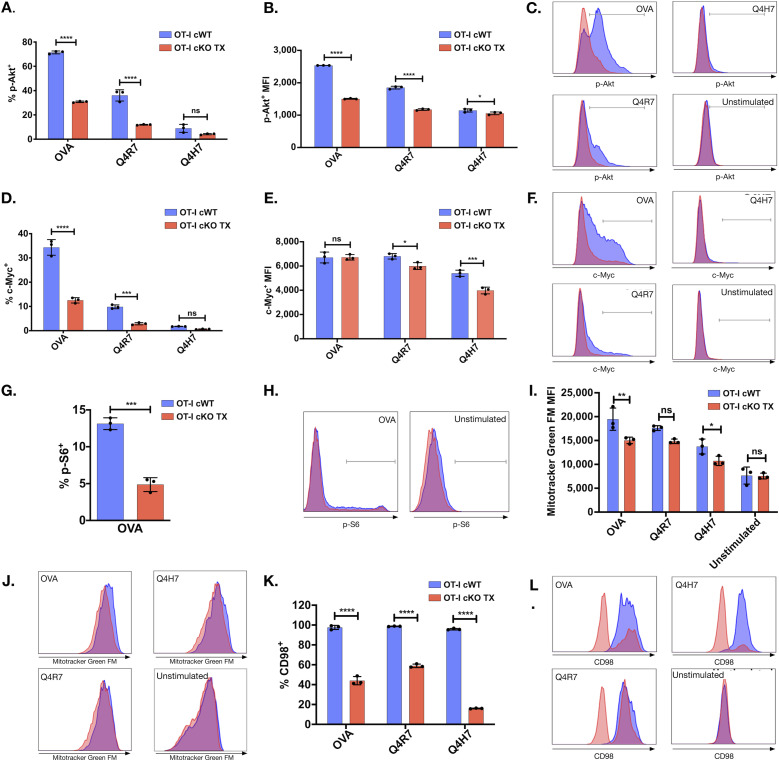
Figure 5. Reduced metabolic regulators in activated Themis-deficient OT-I CD8+ T cells.
(A, B, C, D, E, F, G, H) Naïve Themis cWT (blue) and Themis cKO TX (red) OT-I CD8+ T cells were stimulated with OVA APLs. After 24 h, p-Akt, c-Myc, and p-S6 were measured by flow cytometry in these groups. (A) Proportions of p-Akt-positive cells. (B, C) Bar graph summary of p-Akt MFI in p-Akt-positive cells and histogram showing the levels of p-Akt. (D) Proportions of p-Myc–positive cells. (E, F) Bar graph summary of p-Myc MFI in p-Myc–positive cells and histogram showing the levels of p-Myc. (G) Proportions of p-S6–positive cells. (H) Histogram showing levels of p-S6. Cells were pooled from 3 mice per genotype. (I-L) Naïve Themis cWT and Themis cKO TX OT-I CD8+ T cells were stimulated with OVA APLs for 3 d. (I) Quantification of mitochondrial mass by measuring MFI of MitoTracker Green FM by flow cytometry. (J) Overlaid histograms of Themis OT-I cWT (blue) and cKO TX (red) CD8+ T cells displaying amount of MitoTracker Green FM in the indicated cells. (K) Percentage of CD98 CD8+ T cells in Themis cWT and Themis cKO TX samples. (L) Overlaid histograms of Themis cWT (blue) and OT-I Themis cKO TX (red) CD8+ T cells showing CD98 expression. Cells were pooled from three mice per genotype. Data are representative of three experiments. Samples were compared using two-way ANOVA with multiple comparison test (all graphs except g) and t test (g), with **** indicating P-value < 0.0001, *** P-values from 0.0001 to 0.001, ** P-values from 0.001 to 0.01, and * P-values from 0.01 to 0.05. Values shown here are mean ± SD.

