FIG. 2.
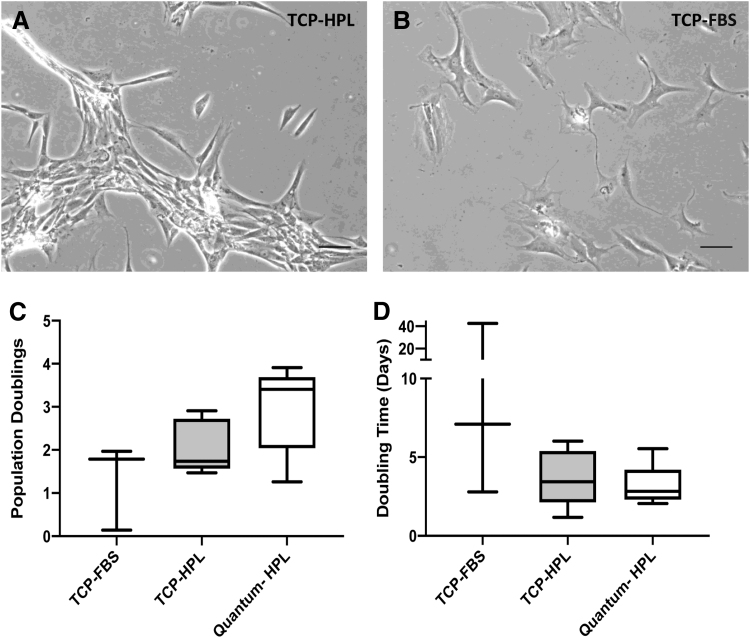
Cell morphologies and growth kinetics of chondrocytes expanded in the Quantum® bioreactor in hPL and on TCP in hPL and FBS. Phase-contrast images of chondrocytes cultured in (A) hPL or (B) FBS at passage 1. Scale bar represents 100 μm. Neither the (C) number of population doublings or (D) the population doubling time, at passage 1–2, was different between chondrocytes cultured in the Quantum® bioreactor cf. TCP in hPL or FBS nor between the matched TCP-cultured (hPL cf. FBS) chondrocytes (paired t-test; p > 0.05). Data are mean ± standard deviation.

