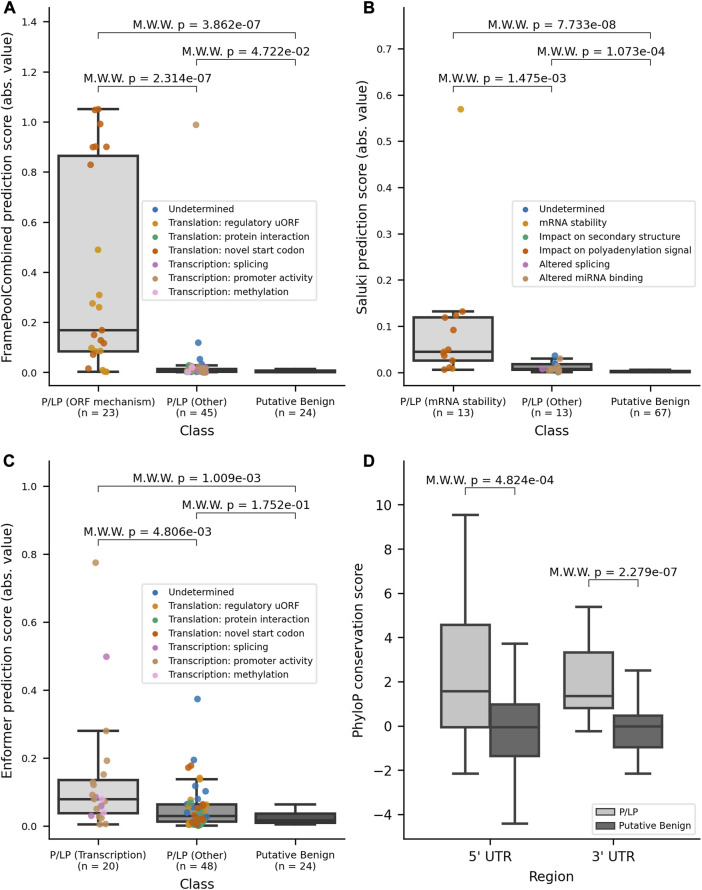
FIGURE 3.
Variant effect scores (absolute values) from DL models for model-matched and model-mismatched variants and PhyloP conservation scores. (A) Distribution of the absolute values of scores for 5′ UTR variants as predicted by FramePoolCombined. (B) Distribution of the absolute values of scores for 3′ UTR variants as predicted by Saluki. (C) Distribution of the absolute values of scores for 5′ UTR variants as predicted by Enformer. (D) Distribution of PhyloP conservation scores for variants in the 5′ and 3′ UTR, stratified by pathogenicity. The boxplots have a center line for the median, the box limits are at the 25th and 75th percentiles, and the whiskers extend to 1.5x the 25th and 75th percentile values. Variants in the P/LP group have been colored based on their curated mechanism. M.W.W, Mann-Whitney Wilcoxon 2-sided test.

