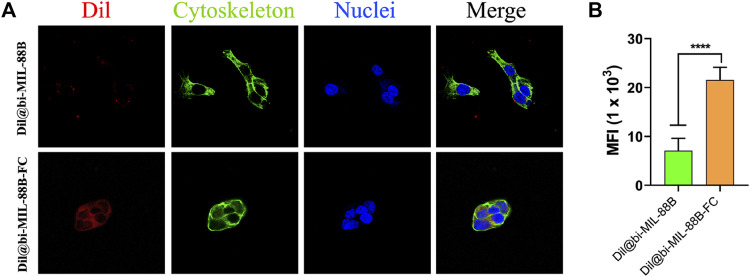
FIGURE 8.
(A) Cellular internalization results of Dil@bi-MIL-88B (top) and Dil@bi-MIL-88B-FC (bottom) against SW480 cells visualized through CLSM. Red fluorescence (Dil), Green (Alexa fluor 488 stained cytoplasm), Blue (DAPI stained nuclei) and Merge (Overlay image); (B) Quantification of the MFI of Dil per cell via ImageJ. Data is shown in mean ± SD (n = 10). ****p < 0.0001.

