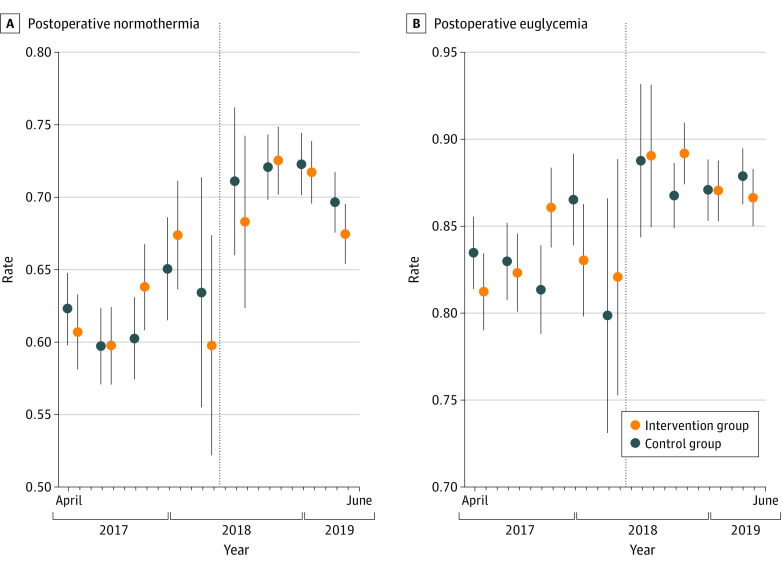
Figure 2. Time Course of Primary Outcomes.
The intervention group received usual care plus the live telemedicine intervention; the control group received usual care only. Error bars represent 95% CIs derived from a linear probability model with cluster-robust SEs. The dotted line represents transition to the Epic electronic health record.

