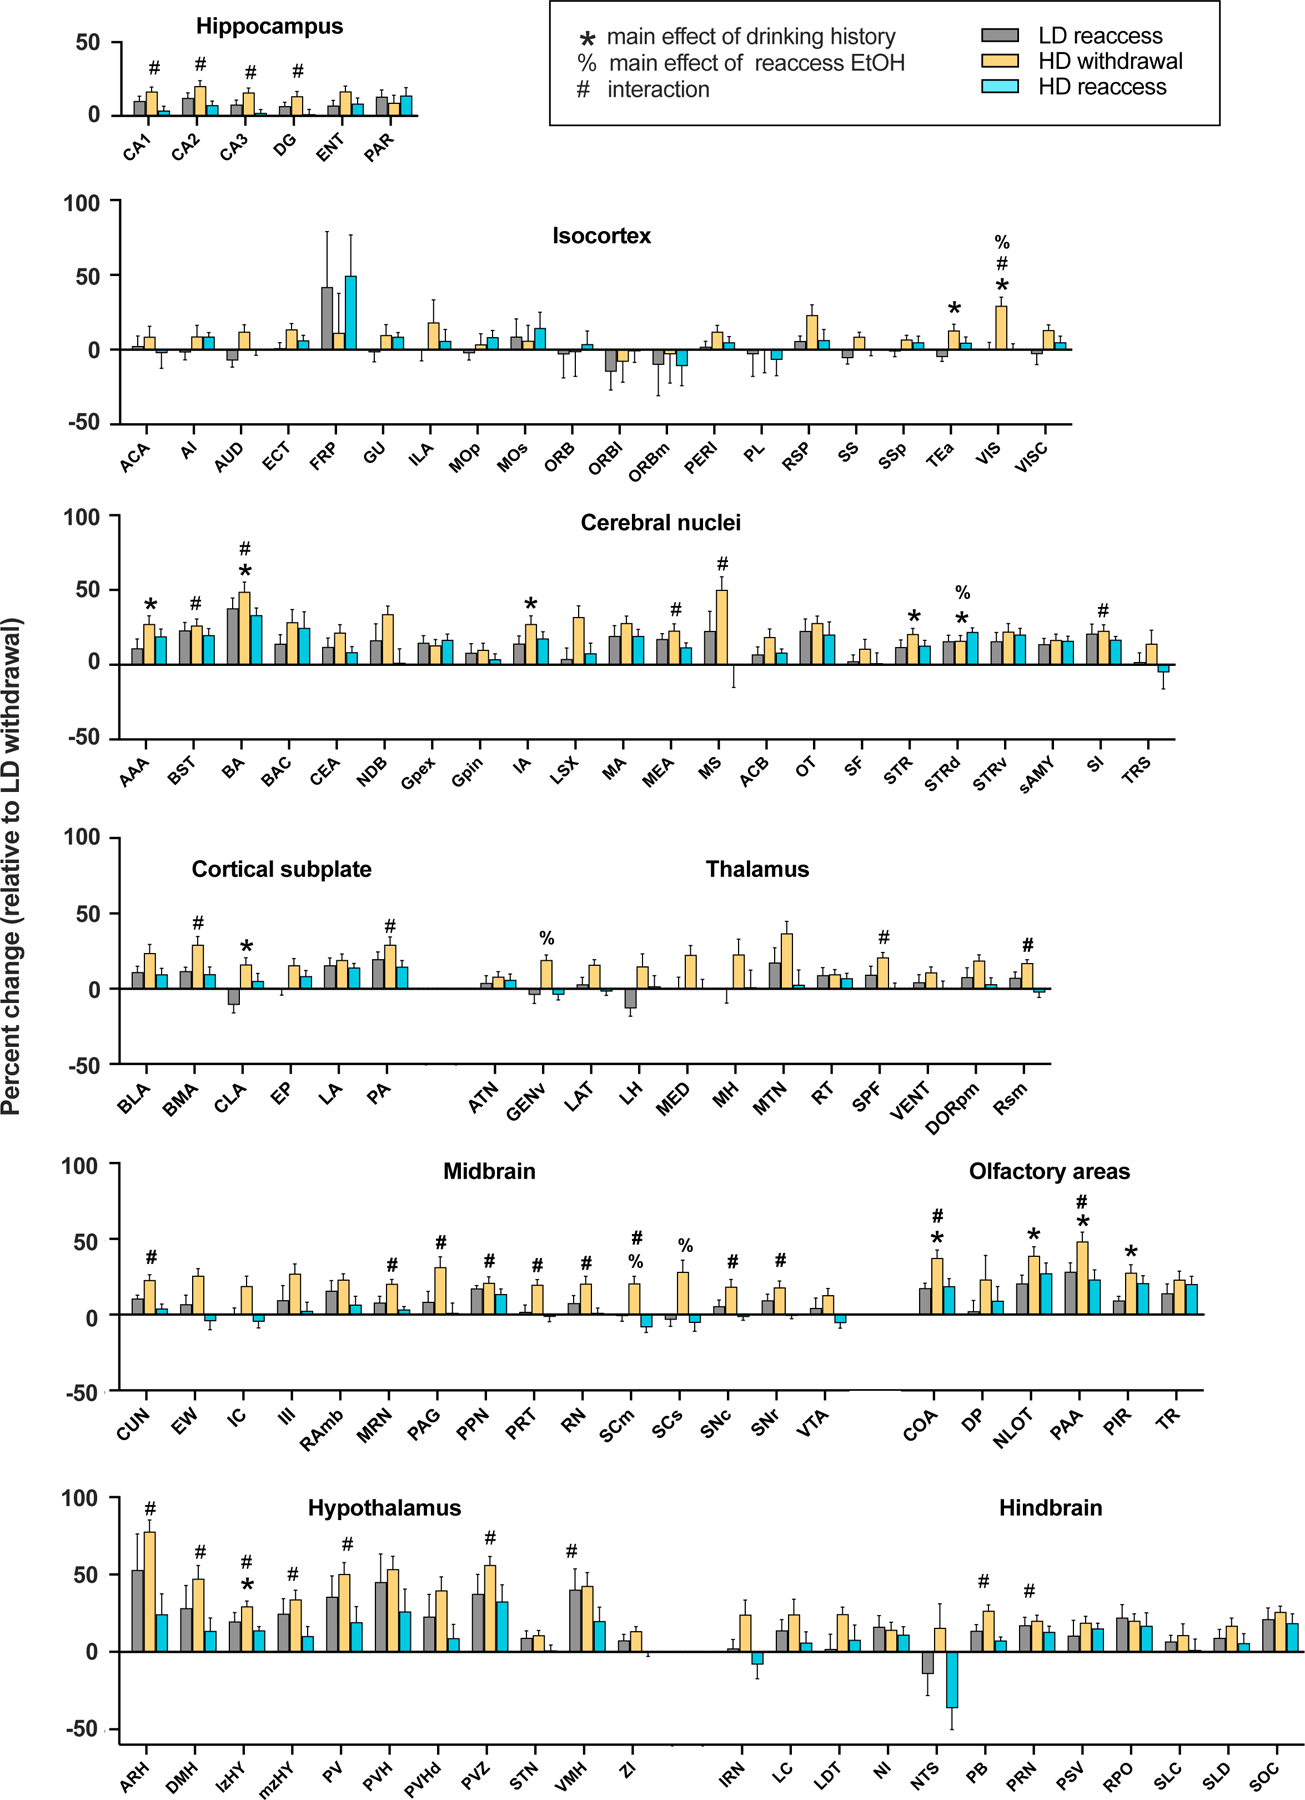
Figure 2.

A, Relative c-fos expression in high- (HD) and low-drinking (LD) mice during acute (24h) alcohol withdrawal and following a 1h alcohol reaccess period. C-fos-positive cell counts for each region are represented as the percent change relative to LD mice during withdrawal. Regions are grouped by anatomical subdivision according to the Allen Brain Atlas. * denotes a significant main effect of drinking history; % denotes a significant main effect of reaccess EtOH drinking; and # denotes a significant interaction between drinking history and alcohol reaccess (2-way ANOVA with FDR correction for multiple comparisons). Post-hoc test p-values are available in Table S3.
