Figure 3.

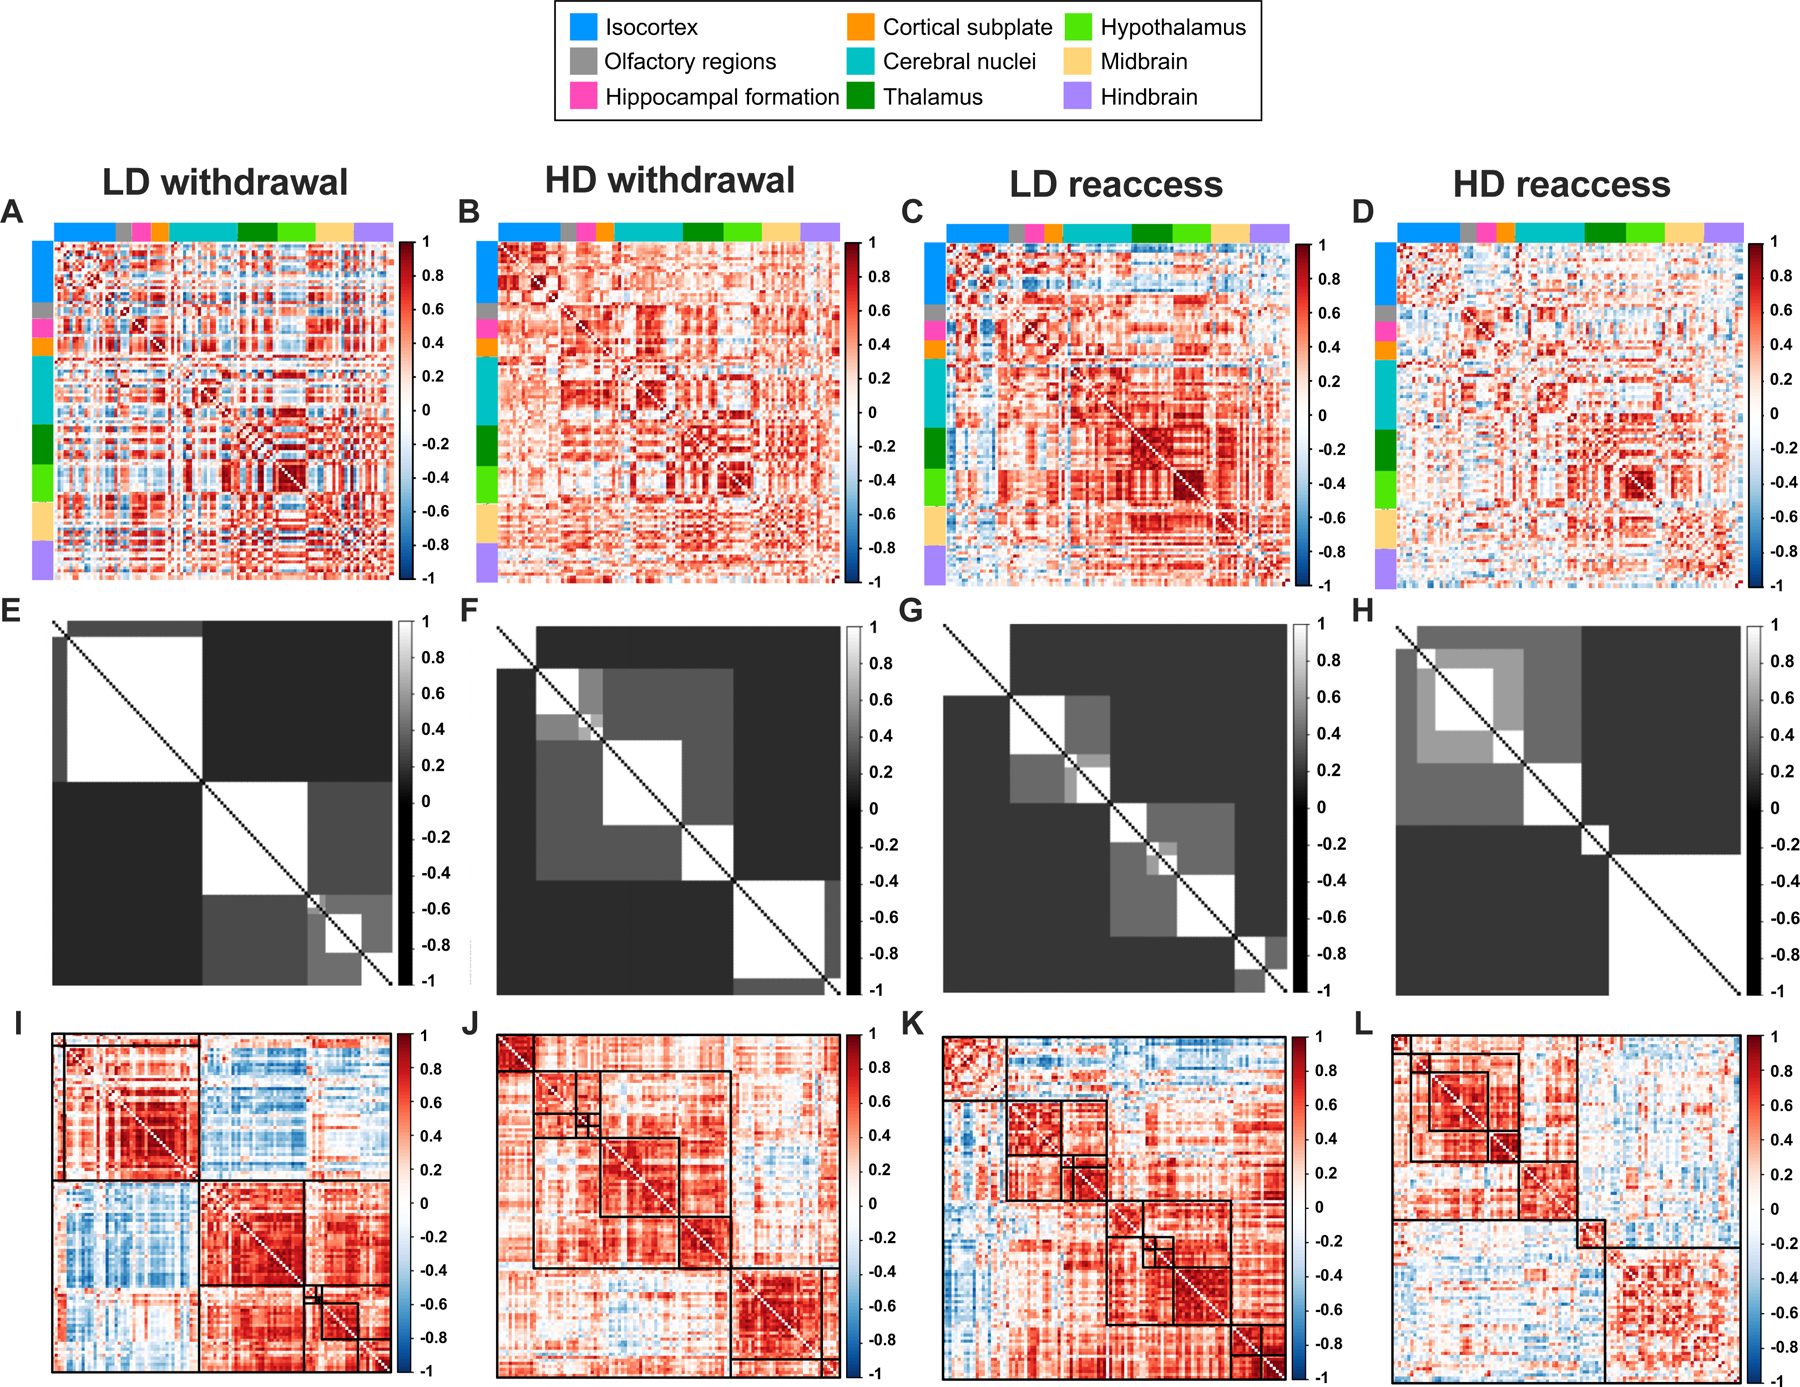
A-D, Pearson correlation matrices showing interregional correlations for the 110 brain regions included in the network analysis for low-drinking (LD) and high-drinking (HD) mice during alcohol withdrawal and following alcohol reaccess. Regions are grouped by anatomical division according to the Allen Brain Atlas. E-H, Hierarchical consensus clustering (HCC) plots illustrating the community partitions of highly correlated regions. I-L, Correlation matrices derived from the HCC procedure illustrating the clustering of strongly correlated regions, denoted by darker shades of red.
