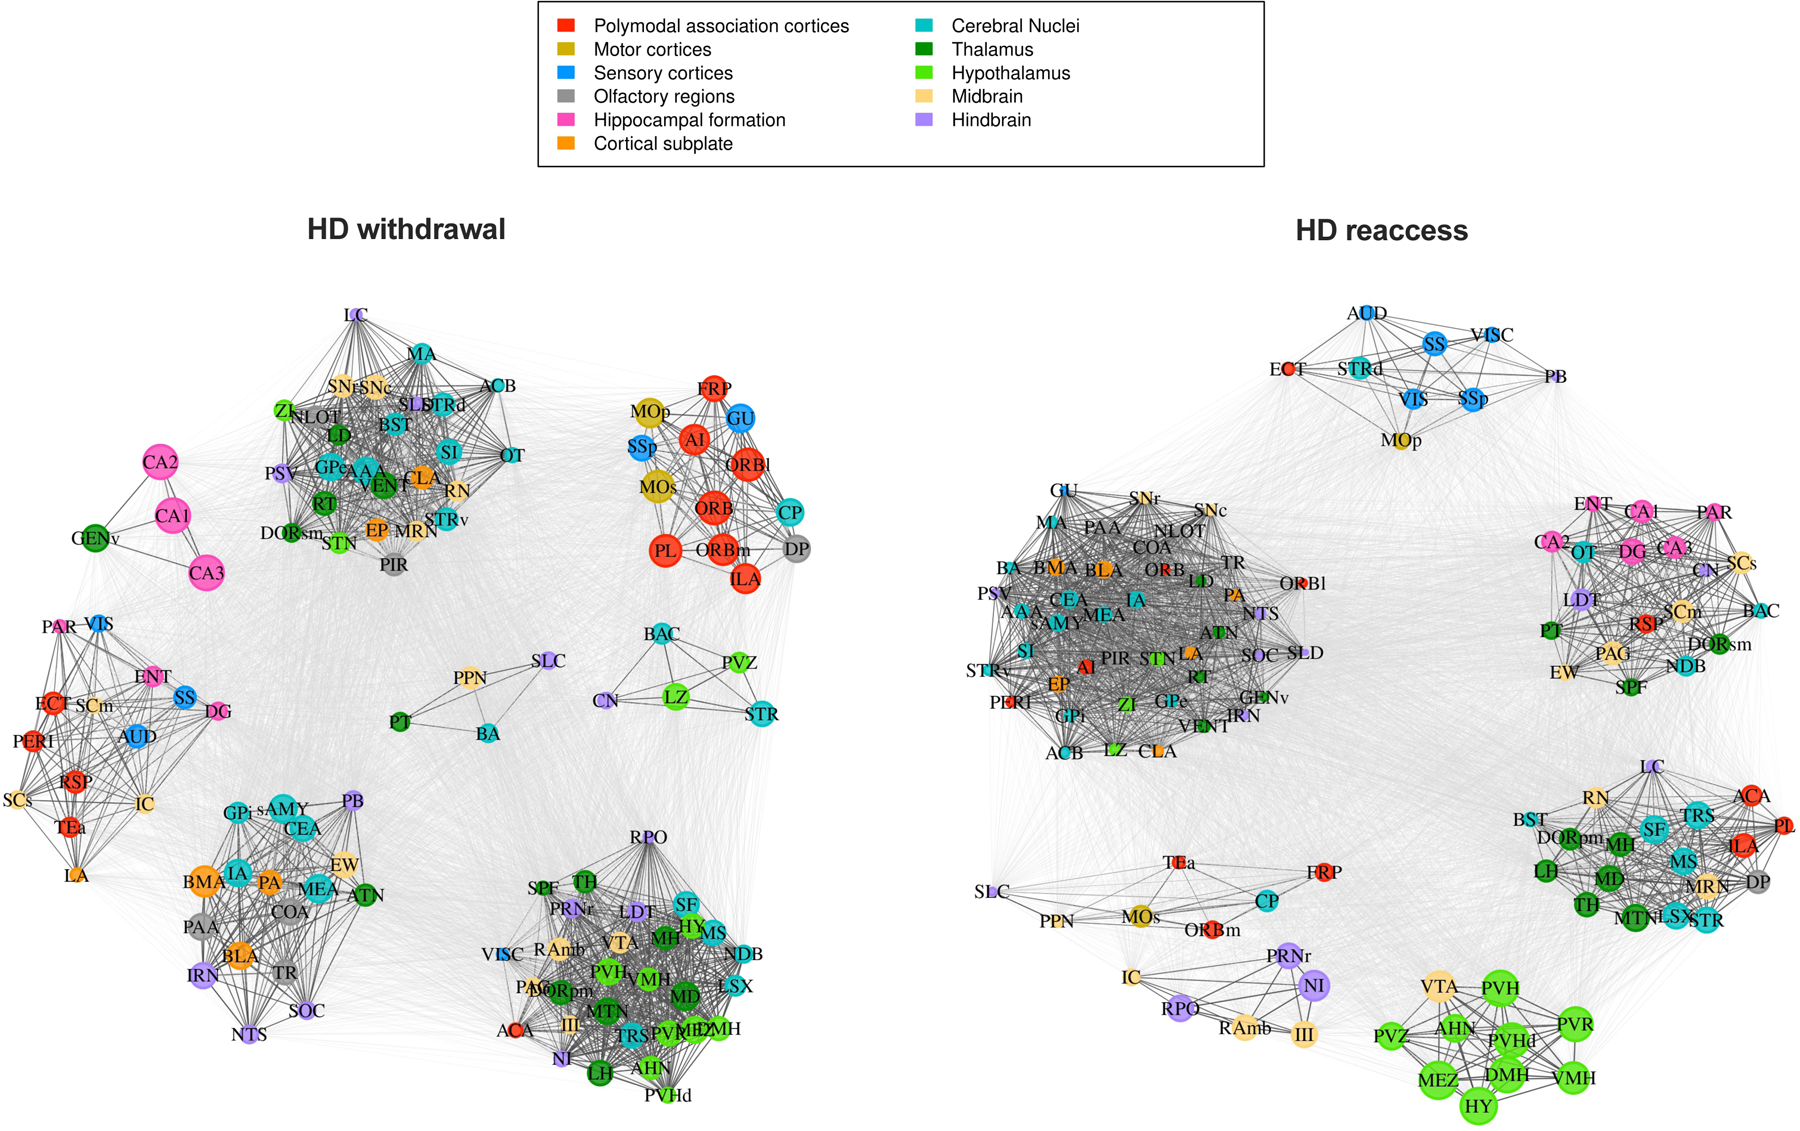
Figure 5.

Network communities for high-drinking (HD) mice in the withdrawal and reaccess conditions. Regions are color-coded according to anatomical groups defined by the Allen Brain Atlas. The size of each node in a community represents the within-community strength, whereas the strength of individual connections is represented by the edge length, i.e., the distance between nodes.
