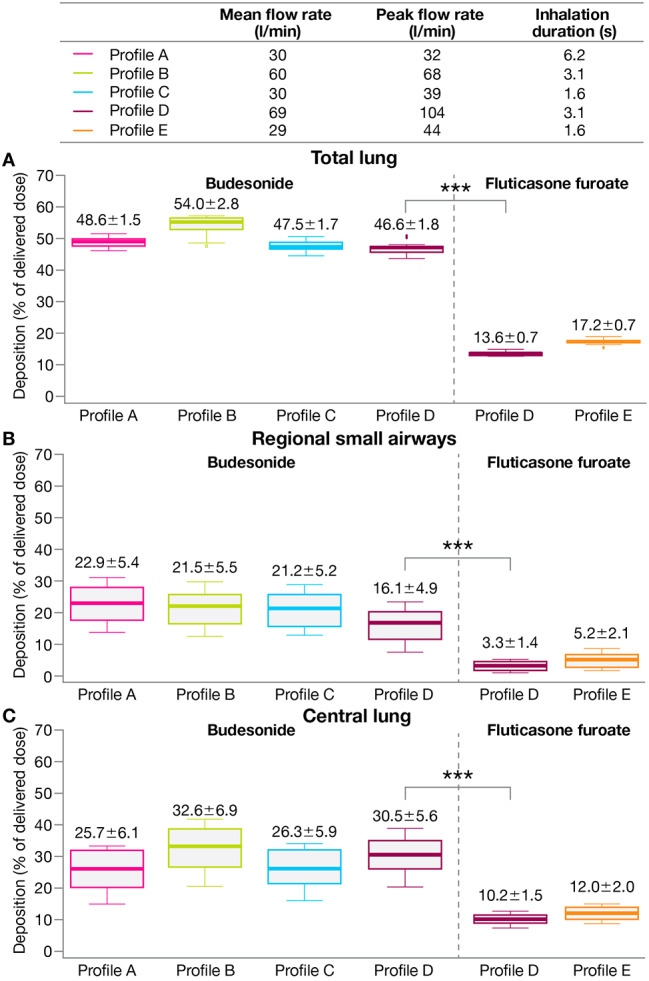
Fig. 5.

A Total lung, B regional small airways, and C central lung deposition for ICS components of each treatment
***Nominal p < 0.001 (paired t-test) for BGF versus FF/UM/VI based on mean difference (95% CI): total lung, 33.0 (32.2–33.9); regional small airways, 12.8 (11.1–14.5); central lung, 20.2 (18.2–22.2)
Data labels: mean ± SD. Extremes of box: upper and lower quartiles. Horizontal line within box: median. Whiskers: extend to most extreme data points no more than 1.5 times the interquartile range. Individual data points beyond whiskers: outliers beyond 1.5 times the interquartile range
BGF, budesonide/glycopyrronium/formoterol fumarate dihydrate; CI, confidence interval; FF/UM/VI, fluticasone furoate/umeclidinium/vilanterol; ICS, inhaled corticosteroid; SD, standard deviation
