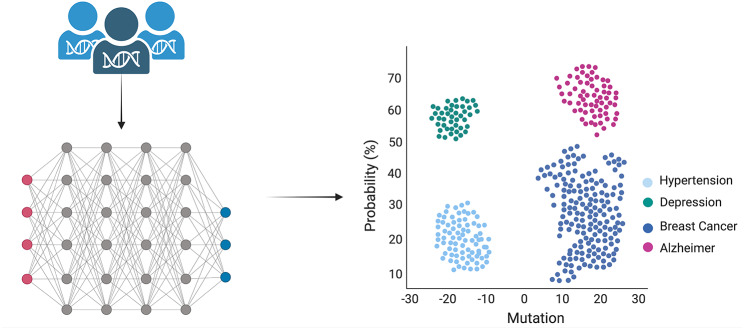
Fig. 2.
Schematic representation of the process starting with the extraction of DNA/RNA, followed by sequencing. The subsequent genotypic alignment is performed using neural networks and deep learning. Probability calculations are achieved through applying statistical methods and M: The graph’s Y-axis denotes the probability (expressed in percentage) of a particular type of disease (hypertension, depression, breast cancer, and Alzheimer’s disease), while the X-axis signifies the count of gene mutations. Negative numbers indicate gene deletions, whereas positive values represent gene additions or nucleic acid mutations

