Table 1.
Definitions of symbols used in causal loop diagrams
| Symbol | Definition |
|---|---|

|
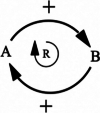
A “ + ” sign denotes that an increase in variable “A” leads to an increase in variable “B”, or a decrease in variable “A” leads to a decrease in variable “B”, all things being equal. That is, variable “A” has a positive relationship with variable “B” |

|
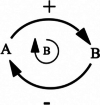
A “ + ” sign denotes that an increase in variable “A” leads to a decrease in variable “B”, or a decrease in variable “A” leads to an increase in variable “B”, all things being equal. That is, variable “A” has a negative relationship with variable “B” |

|
The “R” denotes that the feedback loop is reinforcing, whereby an increase in “A” causes an increase in “B”, leading to a further increase in “A”. A decrease in “A” can also cause a decrease in “B” leading to further decrease in “A”. The feedback loop results in subsequent exponential change—either growth or decay |

|
The “B” denotes that the feedback loop is balancing, whereby an in “A” causes an increase in “B”, leading to a consequent decrease in “A”. Also, a decrease in “A” can cause a decrease in “B”, leading to a consequent increase in “A”. A balancing feedback loop will reach its limit over time and seeks an equilibrium |

|
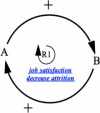
“R1” denotes reinforcing loop 1, a unique identifier given to each reinforcing feedback loop identified. A short description of the feedback loop is included for ease of reference. A table summarising the feedback loops identified traces the causal pathway of each loop. This is done by following the order of the variables described in each feedback loop |

|
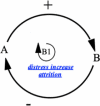
“B1” denotes balancing loop 1, a unique identifier given to each reinforcing feedback loop identified. A short description of the feedback loop is included for ease of reference. A table summarising the feedback loops identified traces the causal pathway of each loop. This is done by following the order of the variables described in each feedback loop |
