Figure 1.
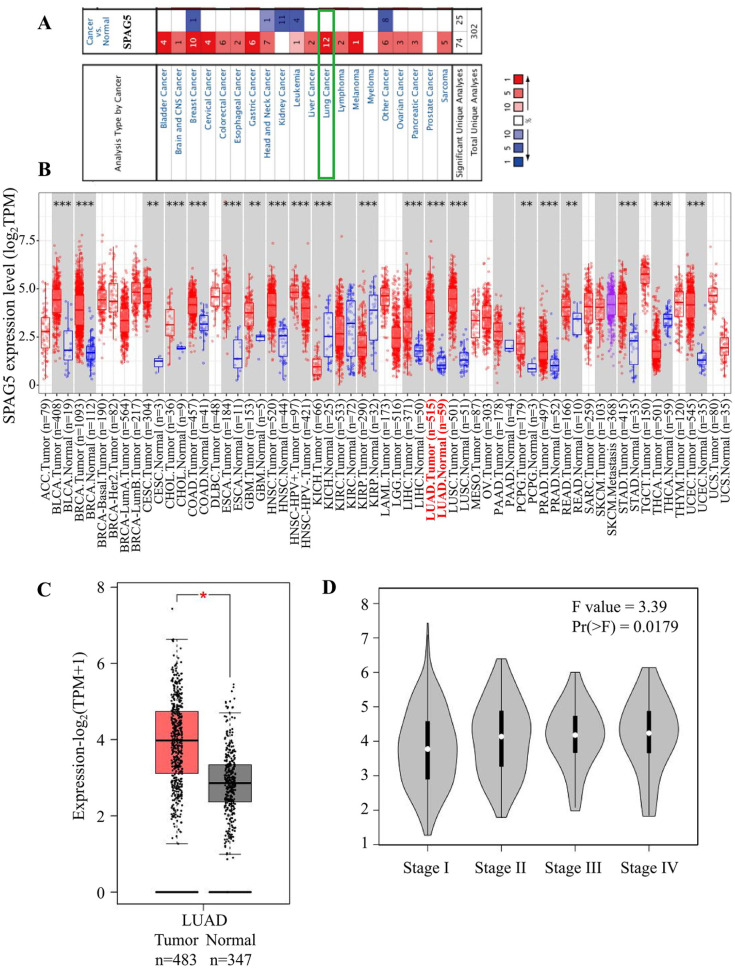
Expression profile and clinical significance of SPAG5 in LUAD. (A) Expression profile of SPAG5 in various tumors and normal tissues derived from the Oncomine database. Upregulation is depicted in red, whereas downregulation is represented in blue. The green box emphasizes the high expression of SPAG5 across 12 lung cancer data sets. (B) Analysis of differential SPAG5 expression between tumors and normal tissues in TCGA pan-cancer was performed using the TIMER2.0 database. Notably, SPAG5 exhibits significantly increased expression in LUAD tumors (highlighted in red font). (C) GEPIA analysis revealed the expression difference of SPAG5 between LUAD tumor and normal tissues in the TCGA and GTEx databases. The box plot indicates a notable upregulation of SPAG5 in tumor tissues. (D) Correlation analysis conducted by GEPIA between TCGA-LUAD clinical staging and SPAG5 expression reveals a positive association between elevated SPAG5 expression levels and advanced tumor staging. CNS indicates central nervous system; GEPIA, Gene Expression Profiling Interactive Analysis; GTEx, genotype-tissue expression; KICH, kidney chromophobe; KIRP, kidney renal papillary cell carcinoma; LUAD, lung adenocarcinoma; SPAG5, sperm-associated antigen 5; TCGA, The Cancer Genome Atlas; TIMER, tumor immune estimation resource.
Statistical significance is denoted as *P < .05; **P < .01; ***P < .001.

