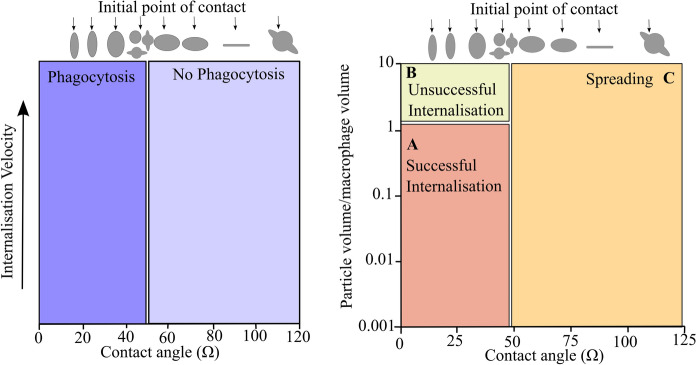
Fig. 7.
Left-hand side represents the ability of phagocytosis to occur depending on the shape of the particle and the initial contact point. The right-hand side displays a phase diagram highlighting the different responses macrophages display post-initiation of phagocytosis, where area (A) represents a complete engulfment of the particle by the macrophage, area (B) represents the incomplete engulfment, and area (C) represents the spreading of the macrophages over the particle surface rather than engulfment—based on Champion and Mitragotri (2006)

