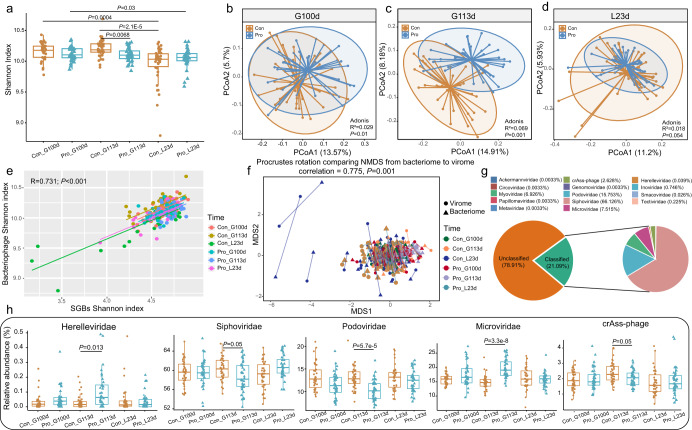
Fig. 4. Changes in the gut phageome in probiotic (Pro) and control (Con) sows from late gestation to lactation.
a Changes in Shannon diversity index at 100 and 113 days of gestation (G100d, G113d) and 23 days of lactation (L23d). c, d Principal coordinates analysis (PCoA) of the gut phageome of the two groups at the three time points. Results of Adonis tests are shown in the right lower corner of the plots. e Correlation between the values of the Shannon diversity index of the gut phageome and species-level genome bins (SGBs) profile. A strong positive correlation was found (R = 0.731; P < 0.001). f Procrustes analysis was performed on the SGBs profile and phageome of the two groups at three time points (i.e., G100d, G113d, and L23d), confirming positive cooperativity between the gut bacterial microbiota and bacteriophages (correlation = 0.775; P = 0.001). g Family-level taxonomic distribution of the phageome metagenome. h Wilcoxon test was used to evaluate significant differential bacteriophages between the two groups at different time points. P values were corrected by the Benjamini-Hochberg procedure, and a P value below 0.05 was considered statistically significant. Data were expressed as the means ± SEM. The center line of the box plot represents the median, the bounds of box represent IQR, and whiskers represent data other than the upper and lower quartiles.

