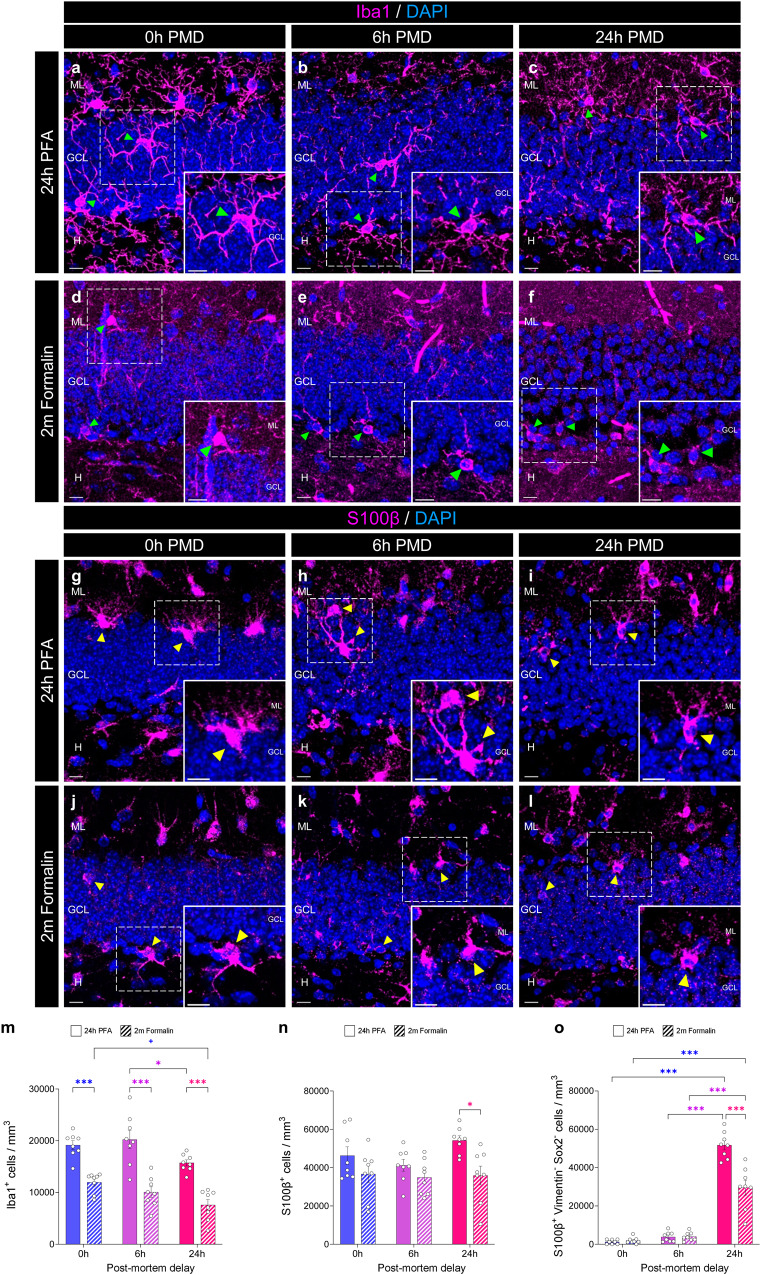
Fig. 4. Effect of the post-mortem delay (PMD) and fixation time on the detection of glial cells.
a–f Representative images of Iba1 staining showing microglial cells under distinct experimental conditions. g–l Representative images of S100 calcium-binding protein β (S100β) staining showing astrocytes under distinct experimental conditions. m Density of Iba1+ microglial cells. n Density of S100β + astrocytes. o Density of Sox2- Vimentin- S100β + mature astrocytes. In a–l, Z-projection images are shown. ML Molecular layer. GCL Granule cell layer. H Hilus. Sox2 SRY (sex determining region Y)-box 2. White scale bar: 10 μm. Green triangles: Iba1+ microglial cells. Yellow triangles: S100β+ astrocytes. Graphs represent mean values ± SEM. n = 8 mice. +0.1 > p ≥ 0.05; *0.05 > p ≥ 0.01; and ***p < 0.001.

