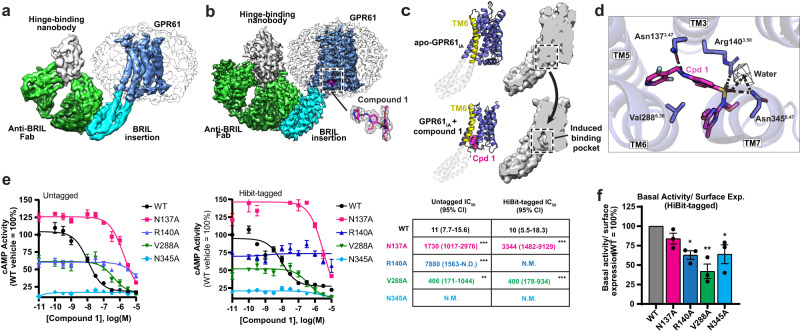
Fig. 3. Structural and functional analysis of compound 1 binding to GPR61IA.
a Cryo-EM map of apo GPR61IA, colored by subunit. The sequence inserted into GPR61 (comprising BRIL and A2AR-derived linker sequences) is colored in cyan. b Cryo-EM map of GPR61 IA bound to compound 1, colored as in a. The compound 1 binding site is indicated by the dotted box. Inset shows compound 1, colored in magenta, fitted into its corresponding map density. c A comparison of apo and compound 1-bound GPR61IA conformations, showing the conformational changes induced by binding of compound 1. Ribbon diagrams, with TM6 highlighted, are shown at left, with a cutaway of the corresponding surface representation shown to the right. d Compound 1 (Cpd 1) is shown in magenta with its binding site, with key interaction residues shown in stick representation. Map density for an ordered water is shown as dark gray mesh. Hydrogen bonds are indicated by dashed lines. e GPR61 cAMP IC50 curves and values for WT GPR61 and the indicated mutants. Parenthetical values in the table represent 95% CI and asterisks indicate statistical significance. f Basal activity of GPR61 WT and mutants normalized to relative surface expression (total activity and expression data are included in Supplementary Fig. 7a, b). Bar plots and error bars represent the mean ± SEM. In panels e, f, statistical significance is indicated with asterisks (*p ≤ 0.05, **p ≤ 0.01, ***p ≤ 0.001) and was assessed using one-way ANOVA with one-sided Dunnett’s post hoc test. N = 3 independent experiments. Source data are provided as a Source Data file.

