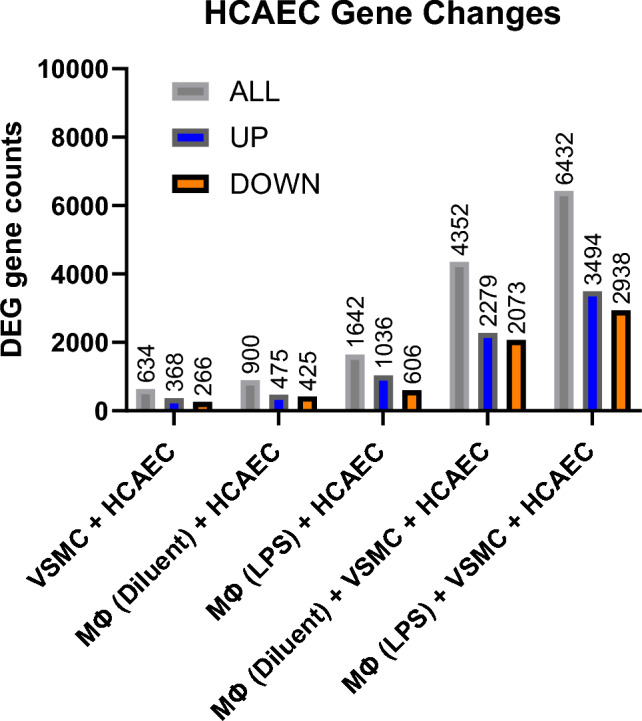
Figure 1.

Differential gene expression analysis of endothelial cells co-cultured in the presence or absence of differentiated THP1 Mɸs and/or VSMCs. HCAECs were co-cultured with differentiated THP1 Mɸs (non-stimulated or LPS-stimulated), VSMCs, or a combination of VSMCs and LPS-stimulated or non-stimulated THP1 cells. Following twenty-four hours of co-culture, HCAECs were isolated from culture. Total RNA was then extracted from HCAECs and processed for RNAseq, as described in “Materials and methods”. The number of differentially expressed genes (DEG gene counts; including up-regulation and down-regulation) for each treatment comparison combination is shown here in a histogram. The comparison group software DESeq2 was used for analysis using a significance threshold (p-value) of ≤ 0.05 for differential gene screening.
