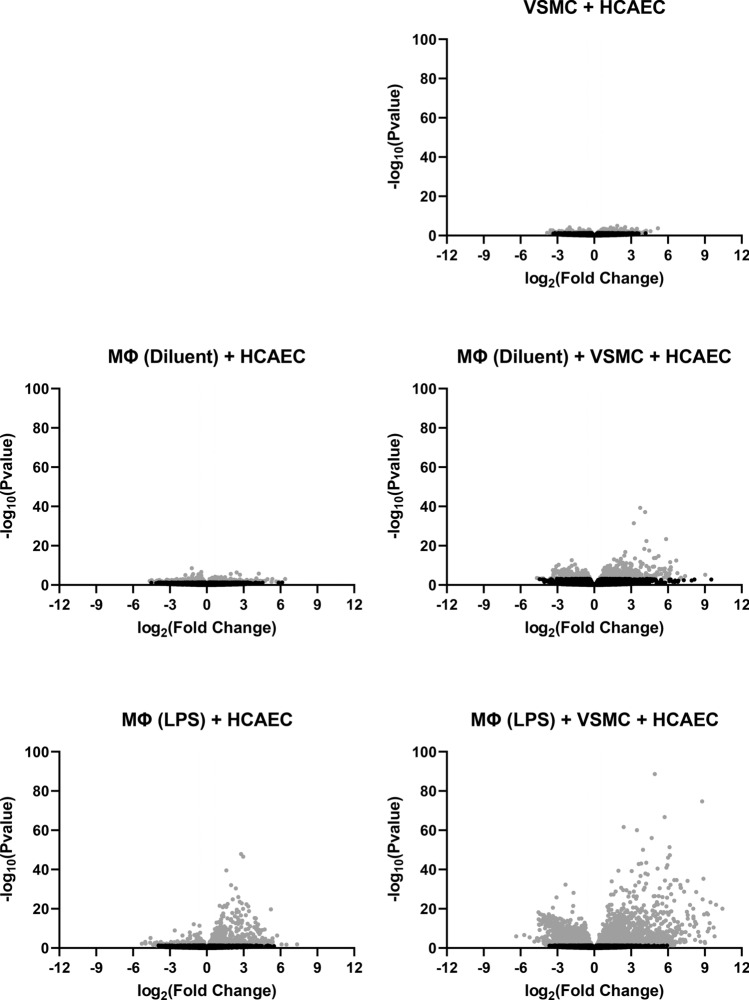
Figure 2.
Distribution of differentially expressed genes in HCAECs cultured in the presence or absence of differentiated THP1 Mɸs and/or VSMCs. The differentially expressed genes identified by RNASeq in the comparison groups described in Fig. 1 were plotted as volcano plots to infer the overall distribution of differentially expressed genes in each treatment comparison group. In the figures, the x-axis shows the fold change in gene expression between different samples, and the y-axis shows the statistical significance of the differences. Significant gene expression changes (p ≤ 0.05; either up- or down-regulated) are shown in light grey. Non-significant protein changes are shown in black. The horizontal, dashed lines indicate the threshold line for differential gene screening criteria (p ≤ 0.05 and > twofold change).

