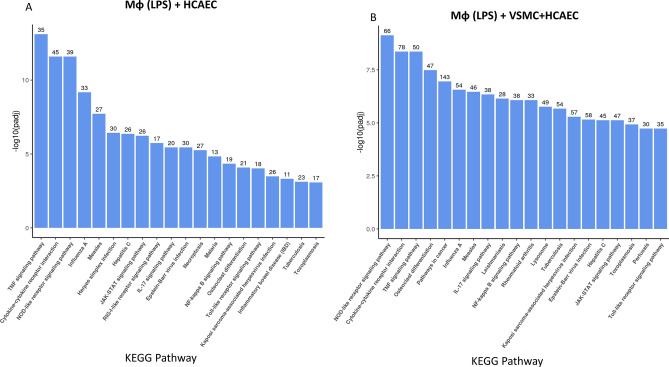
Figure 3.
KEGG analysis of gene expression changes in HCAECs incubated with LPS-stimulated differentiated THP1 Mɸs, in the presence or absence of VSMCs. Upregulated gene expression from HCAECs, co-cultured with LPS-pre-treated differentiated THP1 Mɸs, in the absence (A) or presence (B) of VSMCs, were further analysed to identify common biological functions associated with gene expression changes by comparison with the Kyoto Encyclopaedia of Genes and Genomes (KEGG) database54,55. From the KEGG enrichment results, the most significant 20 KEGG pathways were selected for display as a histogram, with the x-axis indicating the KEGG pathway, and the y-axis represents the significance level of pathway enrichment. The number of genes associated with each KEG pathway is indicated at the top of each bar.

