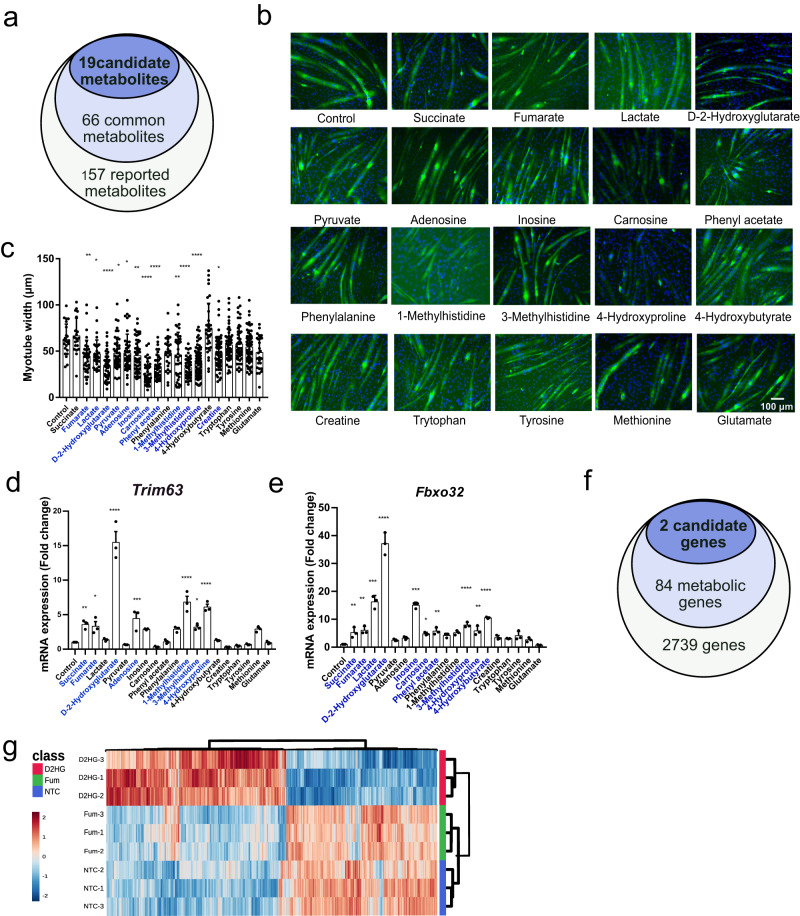
Fig. 1. Screening of cachexia-related metabolites and identification of metabolites that induced muscle wasting.
a Flowchart of the multistep selection of candidate metabolites related to muscle wasting. b Typical immunofluorescence morphological changes after metabolite treatments. Blue indicates DAPI, and green indicates MyHC (scale bar: 100 μm). c Differences in myotube diameters between different metabolite treatments. Each dot represents 1 myotube diameter. One-way ANOVA with post hoc Tukey’s multiple comparison tests (****p < 1e-4, ***p < 2e-4, **p < 2e-3, *p < 0.05). d, e Identification of metabolites that induce high gene expression of the E3 ligase Trim63 and Fbxo32. One-way ANOVA with post hoc Tukey’s multiple comparison tests (****p < 1e-4, ***p < 2e-4, **p < 2e-3, *p < 0.05). f Screening of common genes associated with altered cancer based on a Venn diagram. g Heatmap of differentially expressed genes after D2HG and Fum treatment of well-differentiated myotubes compared to NTC myotubes. Each group was tested in triplicate. Gene expression values are expressed as fragments per kilobase per million.

