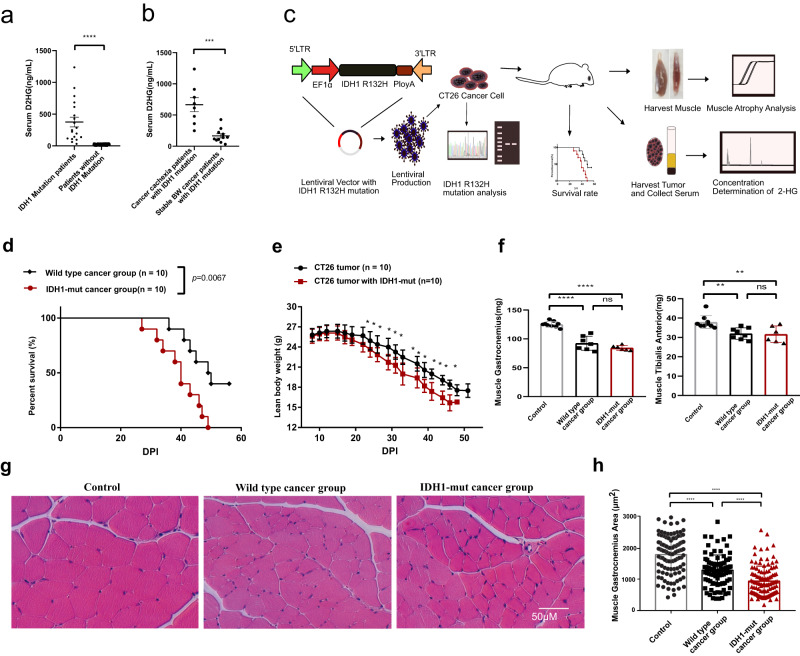
Fig. 2. IDH1 mutation-mediated D2HG accumulation in cancer patients and in vivo experiment of D2HG mediated muscle atrophy.
a Column plot of serum D2GH levels in 194 cancer patients with/without IDH1 mutation. Unpaired two-tailed t-test (****p < 1e-4, ***p < 2e-4, **p < 2e-3, *p < 0.05). b Column plot of serum D2GH levels in cancer cachexia patients with an IDH1 mutation and in cancer patients with stable body weight with an IDH1 mutation. Unpaired two-tailed t-test (****p < 1e-4, ***p < 2e-4, **p < 2e-3, *p < 0.05). c Schematic of the in vivo experimental design for IDH1 (R132H) mutation in CT26 tumor-induced skeletal muscle atrophy and cancer cachexia syndrome. d Survival curve of mice with IDH1 (R132H) mutant cancer and wild-type cancer. Log-rank (Mantel-Cox) test (****p < 1e-4, ***p < 2e-4, **p < 2e-3, *p < 0.05). e Lean body weight (whole body weight - tumor weight) of the IDH1 (R132H) mutant cancer and wild-type cancer. Unpaired two-tailed t-test. (*p < 0.05 IDH1 (R132H) mutant cancer vs. wild-type cancer). f Column plot of the muscle gastrocnemius and anterior tibial muscle in IDH1 (R132H) mutant cancer-bearing mice and wild-type cancer-bearing mice. One-way ANOVA with post hoc Tukey’s multiple comparison test (****p < 1e-4, ***p < 2e-4, **p < 2e-3, *p < 0.05). g Typical cross-section histopathological image of the muscle gastrocnemius (scale bar: 50 μm). h Column plot of the cross-section area of muscle gastrocnemius in IDH1 mutant cancer bearing mice and wild-type cancer-bearing mice. One-way ANOVA with post hoc Tukey’s multiple comparison test (****p < 1e-4, ***p < 2e-4, **p < 2e-3, *p < 0.05).

