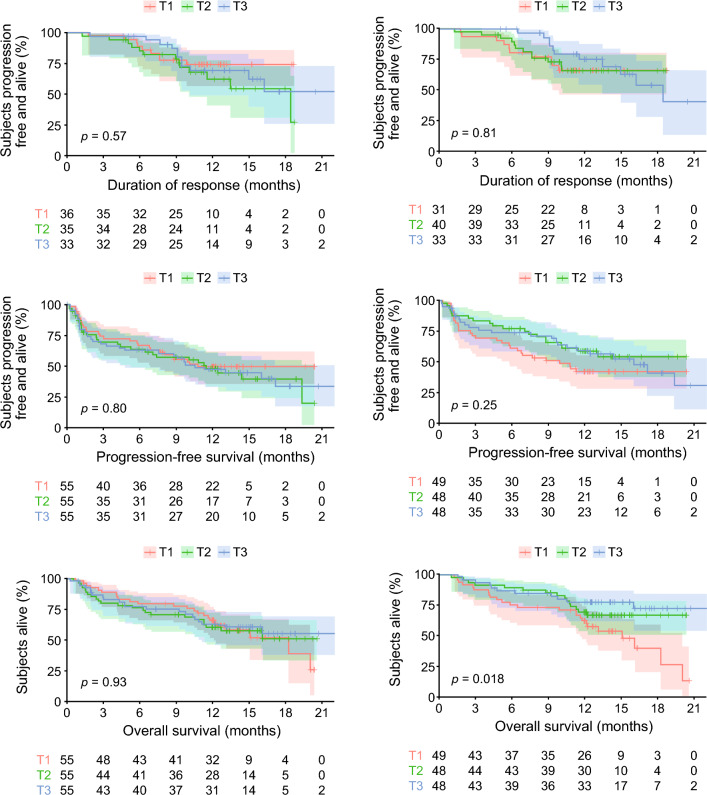
Fig. 5.
DoR, PFS, and OS stratified by predicted Cave,1stdose and Ctrough,4doses tertiles for RP2D. Numbers below the plots represent the number of patients at risk at each time point. Cave,1stdose average concentration during the first treatment dose, Ctrough,4doses trough concentration after the first four weekly treatment doses (i.e., predose concentration of the fifth weekly treatment dose), DoR duration of response, OS overall survival, PFS progression-free survival, RP2D recommended phase II dose (which is 1.5 mg/kg teclistamab SC administered weekly, with the first treatment dose preceded by step-up doses of 0.06 and 0.3 mg/kg), SC subcutaneous, T1 lowest exposure tertile group, T2 middle exposure tertile group, T3 highest exposure tertile group

