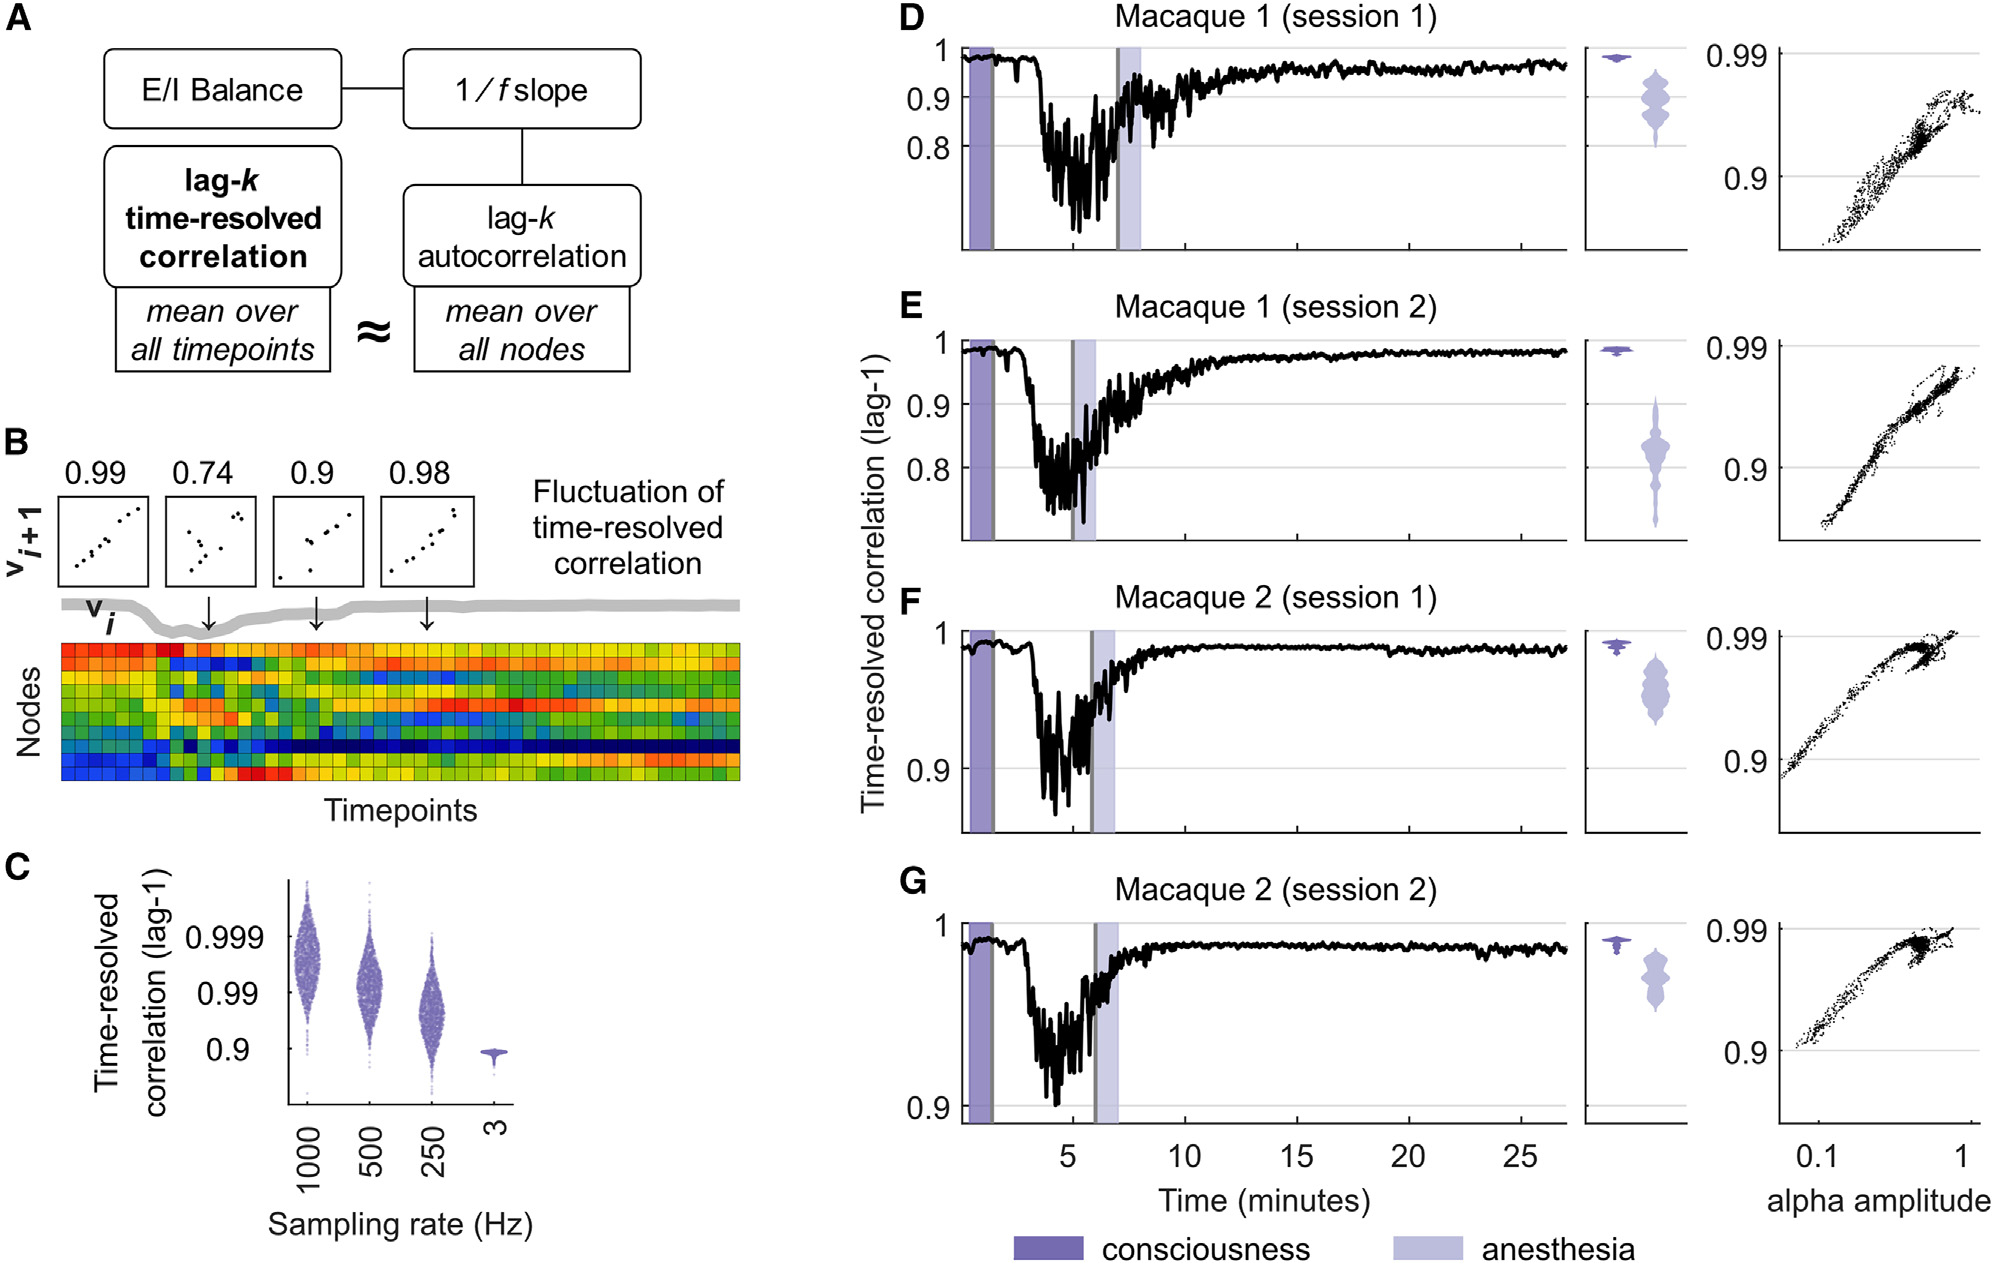
Figure 1. Motivation for, and properties of, time-resolved correlation.

(A) Analytical links between time-resolved correlation and -based estimates of E-I balance. See the main text for details.
(B) Fluctuations of time-resolved correlation in a spatiotemporally subsampled macaque electrocorticography recording. Scatterplots show temporally adjacent patterns of distributed brain activity. Numbers denote corresponding values of time-resolved correlation, and the thick gray line shows the dynamics of time-resolved correlation over time.
(C) Distributions of lag-1 time-resolved correlation pooled across all intracranial EEG recordings (sampled at 1,000, 500, and 250 Hz), and separately for brain-wide calcium imaging data (sampled at ~3 Hz).
(D–G) Lag-1 time-resolved correlation tracks changes between consciousness and propofol anesthesia across two electrocorticography recordings of two macaque monkeys. (Left) Dark-purple intervals denote 1-min intervals immediately prior to injection of propofol. Light-purple intervals denote 1-min periods immediately following onset of anesthesia based on video observation. (Center) Violin plots of time-resolved correlation densities within shaded light-blue and dark-blue periods. (Right) Corresponding scatterplots of alpha amplitude and time-resolved correlation, averaged over 8-s windows.
