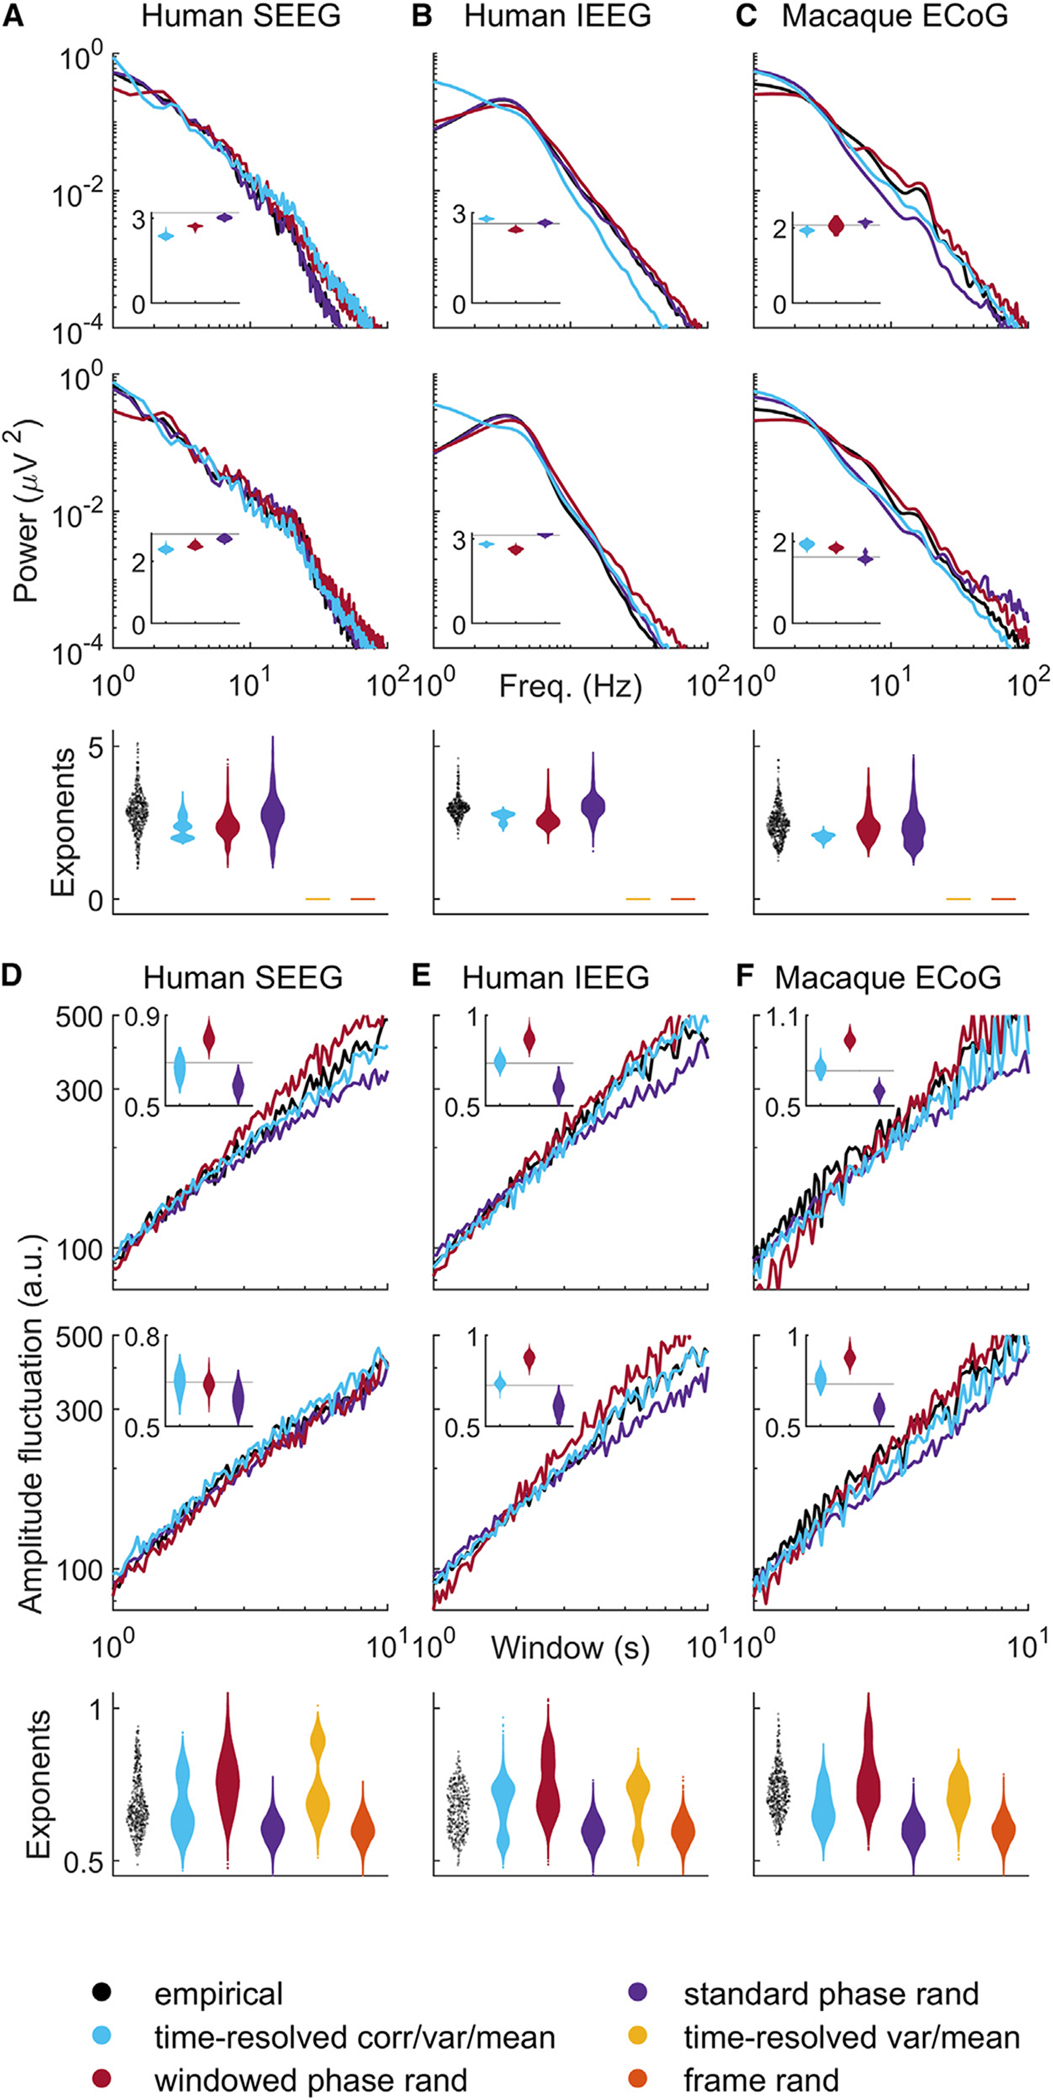
Figure 4. Time-resolved correlation accounts for empirical scaling and long-range temporal correlations.

(A–C) Top two panels show scaling of spectral power as a function of frequency for two channels of representative intracranial EEG recordings. Insets show violin plots of slope exponents benchmarked against empirical exponents (solid black lines). Bottom panels show violin plots of exponents pooled across all channels and all empirical and model datasets.
(D–F) Top panels show scaling of time-resolved amplitude as a function of window for two representative channels. Insets show violin plots of scaling exponents, benchmarked against empirical exponents (solid black lines). Bottom panels show violin plots of all exponents pooled across all channels and all empirical and model datasets. Results on model time series were derived using 50 samples for each model of each dataset. For completeness, Figures S9–S20 show individual results for all empirical and model datasets. SEEG, stereotactic EEG; IEEG, intracranial EEG; ECoG, electrocorticography.
