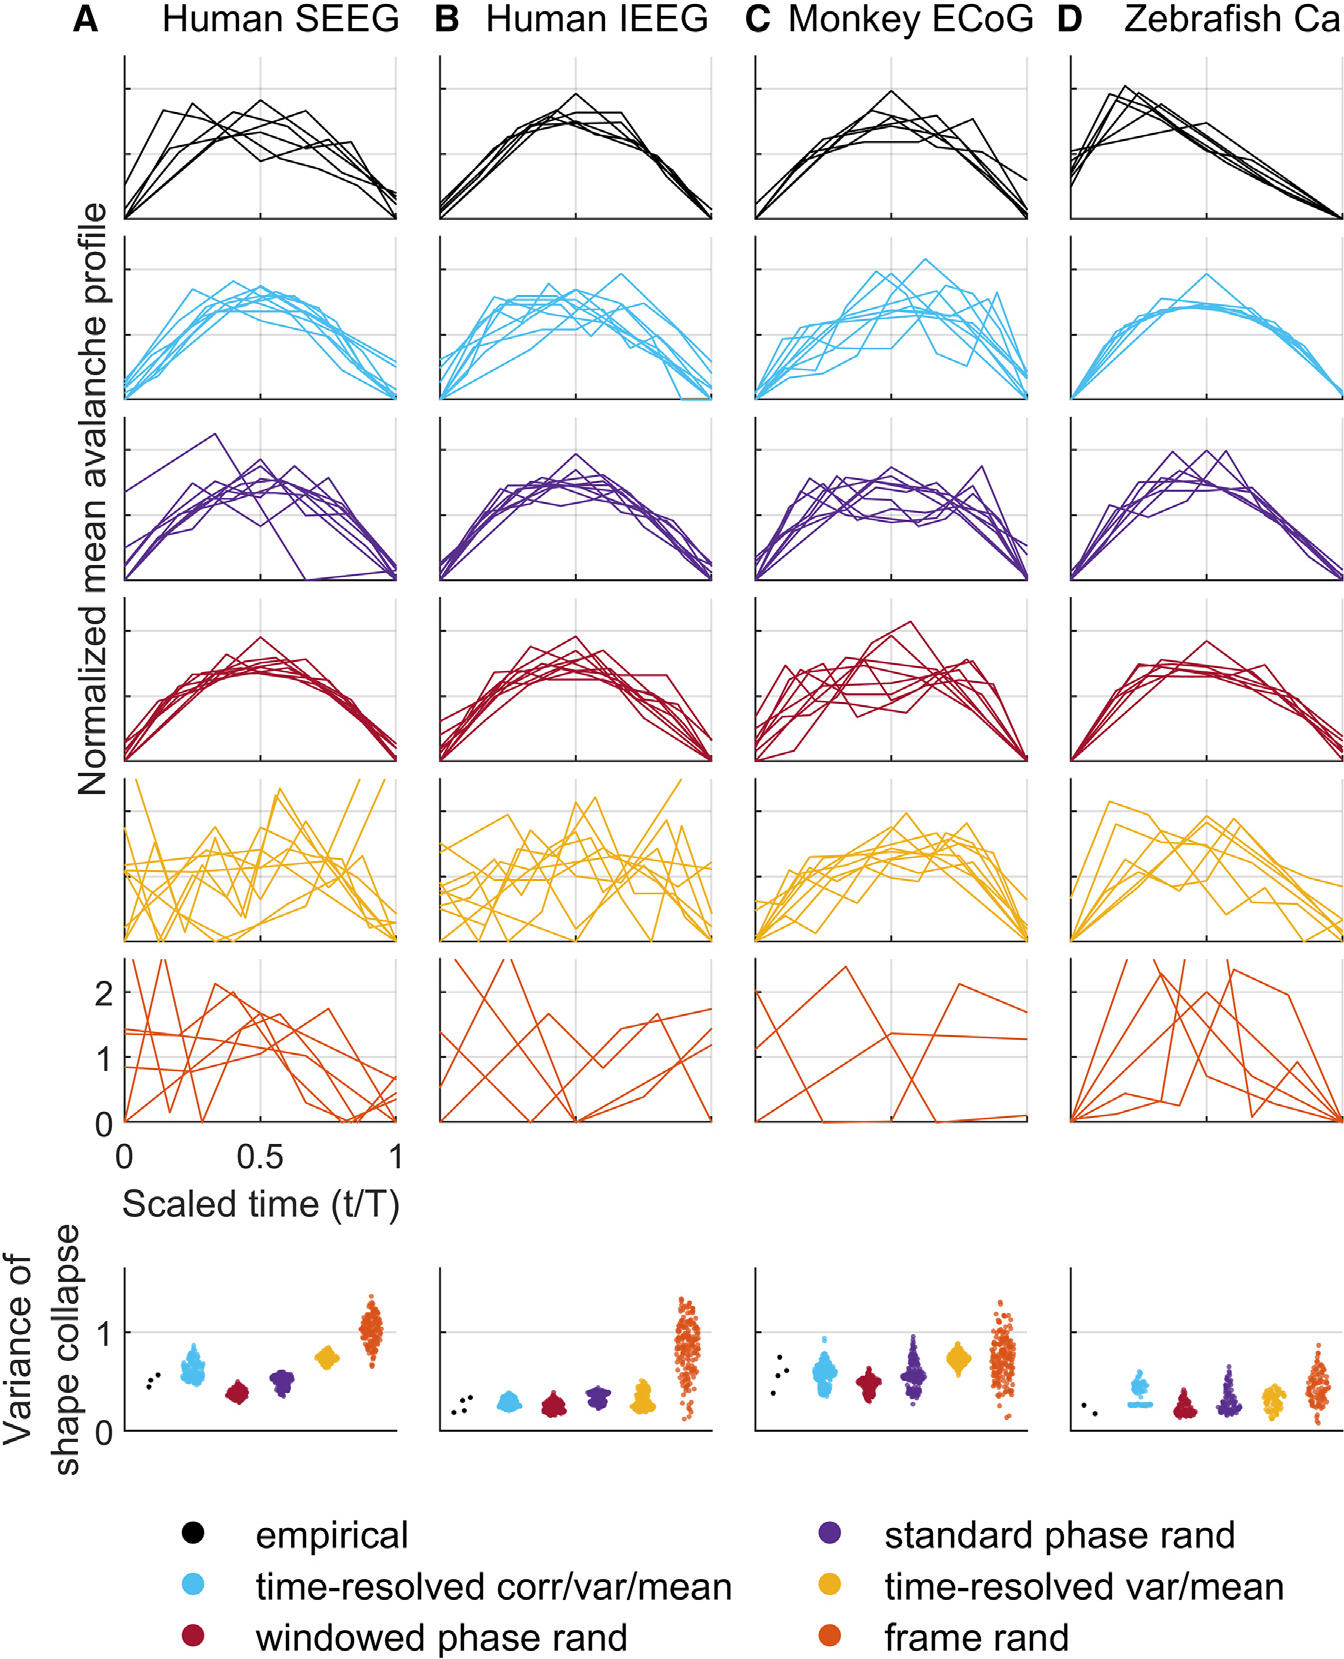
Figure 6. Time-resolved constraints account for universal shape collapse.

(A–D) Shape collapses: scaling of mean temporal profiles with avalanche activity. Bottom panels show violin plots of all empirical and model variance between avalanche scaling profiles (lower is better). Results on model data were derived using 50 samples for each model of each dataset. For completeness, Figures S21–S33 show individual results for all empirical and model datasets. SEEG, stereotactic EEG; IEEG, intracranial EEG; ECoG, electrocorticography; Ca, calcium imaging.
