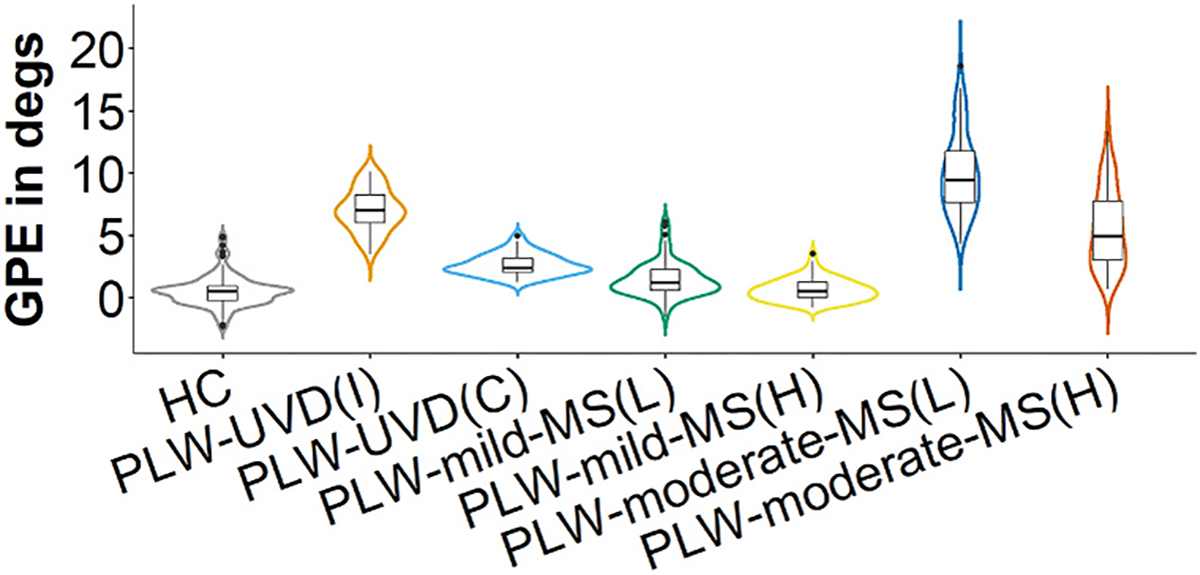
Fig. 3.

Gaze position error. The data for gaze position error (GPE) for each group is depicted by overlaying a box plot on a violin plot. The box plot provides a traditional visualization of the median and interquartile range and the violin plot shows the distribution of the data. HC = healthy control. PLW-UVD = people living with unilateral vestibular deafferentation. PLW-mild-MS(L) = people living with mild multiple sclerosis, lower VOR gain side. PLW-mild-MS(H) = people living with mild multiple sclerosis, higher VOR gain side. PLW-moderate-MS(L) = people living with moderate multiple sclerosis, lower VOR gain side. PLW-moderate-MS(H) = people living with moderate multiple sclerosis, higher VOR gain side. Degs = degrees.
